Protein Distribution and Muscle-Related Outcomes: Does the Evidence Support the Concept?


1
Department of Nutrition Science, Purdue University, 700 W State St, West Lafayette, IN 47907, USA
2
Department of Pediatrics, University of Arkansas for Medical Sciences, 4301 W Markham St, Little Rock, AR 72205, USA
3
Arkansas Children’s Nutrition Center, 15 Children’s Way, Little Rock, AR 72202, USA
*
Author to whom correspondence should be addressed.
Nutrients 2020, 12(5), 1441; https://doi.org/10.3390/nu12051441
Submission received: 1 April 2020
/
Revised: 13 May 2020
/
Accepted: 15 May 2020
/
Published: 16 May 2020
Abstract
:There is a shift in thinking about dietary protein requirements from daily requirements to individual meal requirements. Per meal, stimulation of muscle protein synthesis has a saturable dose relationship with the quantity of dietary protein consumed. Protein intake above the saturable dose does not further contribute to the synthetic response; the “excess” amino acids are predominantly oxidized. Given that daily dietary protein intake is finite, finding protein distribution patterns that both reduce amino acid oxidation and maximize their contribution towards protein synthesis (in theory improving net balance) could be “optimal” and is of practical scientific interest to promote beneficial changes in skeletal muscle-related outcomes. This article reviews both observational and randomized controlled trial research on the protein distribution concept. The current evidence on the efficacy of consuming an “optimal” protein distribution to favorably influence skeletal muscle-related changes is limited and inconsistent. The effect of protein distribution cannot be sufficiently disentangled from the effect of protein quantity. Consuming a more balanced protein distribution may be a practical way for adults with marginal or inadequate protein intakes (<0.80 g·kg−1·d−1) to achieve a moderately higher total protein intake. However, for adults already consuming 0.8–1.3 g·kg−1·d−1, the preponderance of evidence supports that consuming at least one meal that contains sufficient protein quantity to maximally stimulate muscle protein synthesis, independent of daily distribution, is helpful to promote skeletal muscle health.
1. Introduction
In both the United States and Canada, dietary protein recommendations are expressed on a daily basis. For apparently healthy adult men and women, 0.66 and 0.80 g·kg−1·d−1 of “good-quality” protein denote the protein estimated average requirement and recommended dietary allowance, respectively [1]. These rounded estimates, based on a meta-analysis of 19 nitrogen balance studies, were determined by interpolating the quantity of dietary protein needed per day to achieve zero balance (whole-body nitrogen equilibrium between input and output). When the body is in zero nitrogen balance, protein breakdown presumably equals protein synthesis [2]. By the mid-20th century, it was understood that protein synthesis fluctuated in response to essential amino acid consumption [3,4,5,6]. Consequently, the meal-to-meal pattern of protein intake—the within-day protein distribution—was hypothesized to influence daily protein synthesis, protein equilibrium, and nitrogen balance [7].
With the advent of stable-isotope amino acid methodologies, essential amino acid flux (rate of appearance and rate of oxidation) could be used to measure the effect of consuming protein-containing meals on whole-body protein turnover rates. Net protein balance, the gain or loss of body protein, is partly determined by the natural interplay of amino acid metabolism between the “anabolic” postprandial state and the “catabolic” postabsorptive state [8]. However, net protein balance is more easily addressable at the whole-body level and is an infrequently used tissue-specific (e.g., muscle) technique. In the muscle, a more positive muscle protein net balance is posited to occur primarily through stimulating muscle protein synthesis (MPS) via dietary protein and amino acid consumption. This postprandial anabolic response, however, has a “saturable dose limit”: MPS will not be further augmented by the provision of additional amino acids [9,10]. The amino acids ingested in excess of the saturable dose may not be necessarily “wasted.” Instead, they may suppress protein breakdown to promote a more positive net balance [11,12]; however, while this has been demonstrated on a whole-body level, it remains an untested hypothesis in the muscle. A more positive net balance, either meal to meal or daily, should be beneficial for the maintenance, accretion, or retention of skeletal muscle.
Defining the saturable dose limit provided the conceptual rationale for an “optimal” within-day protein distribution. In general, the within-day protein distribution refers to the relationship between the quantities of dietary protein consumed meal to meal to the overall intake. The relative similarity or dissimilarity of the protein quantities between meals is a criterion we define broadly as being either balanced or unbalanced, respectively. A “perfectly” balanced distribution, regardless of the number of eating occasions, would theoretically result in each meal containing equivalent protein quantities. Conversely, the relative protein quantities between meals should vary considerably in an unbalanced distribution. As one example, an unbalanced distribution has been characterized in the diets of younger and older adults in many Westernized societies as being skewed towards the evening meal (Figure 1A) [13,14,15,16,17,18,19,20,21]. The overwhelming majority of individuals consume 2–4 meals for their primary source of dietary protein; this is opposed to, at the extremes of eating frequency, consuming protein in either a continuous fashion (parenteral or enteral nutrition) or in a single eating occasion. Therefore, we consider this typical eating pattern (2–4 meals) as the status quo for the distribution concept, i.e., the base rate is represented by an unbalanced distribution over a few primary meals. A within-day protein distribution is hypothesized to be “optimal” if the following criteria are met: the protein quantity within each meal (1) meets and (2) does not greatly exceed the physiological saturable dose limit (Figure 1B). This would maximize the utilization efficiency of amino acids shunted away from oxidation towards MPS.
Based on the first principal, each meal should contain sufficient protein to elicit a maximal MPS response. Based on the second principal, an “optimal” protein distribution should avoid either excessive or ecologically unattainable protein quantities that shunt excess amino acids towards oxidation. At “higher” total daily protein intakes, an unbalanced protein distribution could meet and exceed the saturable dose limit at each meal (Figure 1C). However, total protein intake is finite. Consequently, there is an economy to how much protein an individual should, could, or would feasibly consume in a day. Knowing this, we need to work within these bounds when making recommendations. For instance, simply recommending higher total protein intakes seems less ecologically feasible than recommending a redistribution of protein from larger protein-containing meals to lower ones; this would create a more balanced within-day protein distribution. However, if total protein intakes are “low”, simply redistributing dietary protein from an unbalanced (Figure 1D) to a more balanced distribution does not necessarily result in an “optimal” protein distribution (Figure 1E). In fact, a low total protein intake, but balanced protein distribution, may be less sufficient to support skeletal muscle health than a low total protein intake with an unbalanced distribution.
This narrative will review the available (to the authors) research related to the protein distribution concept on muscle-related outcomes. Specifically, we review the evidence behind the claims that a protein distribution pattern other than the base rate—an unbalanced distribution (Figure 1A)—will differentially affect muscle related outcomes. In general, these claims favor the consumption of a balanced protein distribution pattern over the status quo (e.g., “optimal”; Figure 1B): A typical unbalanced protein distribution in which incidentally at least one meal/day contains sufficient protein quantity to maximally stimulate MPS, independent of distribution.
2. Observational Research
Observational research is useful for documenting the potential relationship between dietary patterns and clinically relevant endpoints. To date, we are aware of 12 observational studies that investigated associations between the within-day protein distribution and various skeletal muscle-related endpoints [22,23,24,25,26,27,28,29,30,31,32,33] (Table 1). This section has been divided into three subsections based on how the authors of the included studies decided to investigate the protein distribution concept: (1) based on the degree of protein distribution using a coefficient of variation (CV) for protein intake among the main meals; a lower CV denotes a relatively more balanced distribution than a higher CV; (2) based on the number of meals that meet a certain criterion, or threshold, of protein quantity; more meals reaching the target threshold would indicate a “move” towards a more balanced protein distribution; (3) based on when at least a single meal or more does not reach the target threshold; this would indicate a “move” away from a balanced protein distribution.
2.1. Degree of Protein Distribution
Prior to the acute randomized controlled trials that popularized the protein distribution concept known today [34,35,36], there was evidence that the within-day protein distribution could influence whole-body nitrogen metabolism [37,38,39]—the details of which will be discussed in a later section. With this early framework, Bollwein et al. [22] stratified participants according to frailty status: non-frail, pre-frail, and frail. For each group, they calculated an average CV among the main meals. Although total daily protein intakes were comparable (~1.1 g·kg−1·d−1), non-frail participants reported a more balanced protein distribution [0.68 au (0.15–1.24); median (min–max)] than both pre-frail [0.74 (0.07–1.29)] and frail [0.76 (0.18–1.33)] participants. After the retrospective analysis estimating the saturable dose limit in adults was published [10], Gingrich et al. [23] followed up with an investigation into how CV related with muscle mass, strength, and power; however, they reported that no such associations were present in their sample. These results apparently disagree with Bollwein et al. [22]; however, the cohort assessed by Gingrich et al. [23] is more homogenous and apparently “healthier”. Gingrich et al. [23] reported a mean CV of 0.53 ± 0.19 (arbitrary units ± SD) among all participants, which, when compared to the sample from Bollwein et al. [22], is more similar to the median CV of the non-frail volunteers [0.68 (0.15–1.24)] than the other groups. The authors [23] speculated that it is possible that within a cohort of non-frail volunteers with an already relatively balanced protein distribution [22], a more balanced protein distribution would not potentiate an association with muscle strength. These limited results would also suggest that protein distribution may be associated with skeletal muscle-related outcomes in functionally limited older adults but not necessarily in those who are apparently healthy, who tend to be those who are physically active.
Physical activity improves muscle strength in adults and “sensitizes” the muscle to protein feeding, enhancing MPS for up to 48 h after exercise [40]. In light of the lack of published research relating protein distribution to physical function, Ten Haaf et al. [24] combined data from two published studies in the Netherlands. Participants were divided into tertiles based on their protein distribution CV of the main meals: balanced (CV < 0.43); intermediate (CV 0.43–0.62); unbalanced (CV > 0.62). They reported [24] that a balanced protein distribution was associated with greater gait speed compared to the intermediate group only, but not hand grip strength, balance, chair rise ability time, or any of the quality of life outcomes. The adults comprising the total sample produced a wide range of physical activity levels. Within a subgroup of the less physically active adults, who could feasibly be more functionally limited, it is possible that protein distribution would be related with more of the outcomes assessed. This would be consistent with the results from Bollwein et al. [22] and Gingrich et al. [23]; however, this is only conjecture.
To our knowledge, two retrospective cohort studies have been published documenting relationships between protein distribution (CV) and changes in lean mass and physical function. Using baseline and 2 y follow-up data from the Quebec Longitudinal Study on Nutrition as a Determinant of Successful Aging study [25,26], Farsijani et al. [25] investigated whether CV was associated with whole-body and appendicular lean mass either at each time point or with their decline over two years. At baseline, protein distribution was associated with greater lean mass and appendicular lean mass but was not associated with the decline in lean mass over time. Using data from the same parent study, Farsijani et al. [26] performed a similar analysis on muscle strength and mobility outcomes after a three-year follow up. A more balanced protein distribution (CV) was associated with higher muscle-strength scores in men and women and greater mobility scores, but only in men without adjusting for covariates. Protein distribution was not associated with three-year declines in strength and mobility. The authors posited the lack of an association over time may be due to the duration of the follow-up periods. It is possible that two or three years is not long enough to detect associations between protein distribution and changes in lean mass and muscle strength among a free-living cohort. However, this would indicate that if protein distribution does in fact influence muscle-related outcomes, the effect is both small and incremental; it would require individuals to repeat the dietary behavior for long durations in order to marginally benefit.
Collectively, four [22,24,25,26] of five [22,23,24,25,26] studies reported a cross-sectional association between a more balanced protein distribution (CV) and at least one outcome among the cluster of outcomes listed in each study’s primary aim. However, the results of one study (women only [26]) are confounded by differences in total protein intakes between groups. Collectively, the results suggest relatively more balanced protein distributions (CV), when total protein intakes are greater than the protein recommended dietary allowance, are associated with more favorable skeletal muscle-related outcomes.
2.2. Number of Meals Reaching a Target Threshold
The previous section compared and contrasted studies that defined protein distribution by the degree of “balancing”. That is, protein distribution was quantified on a continuous scale between 0 and 1 (0 being the most balanced). Another method of exploring the protein distribution concept is to assess whether the number of meals people consume that reach a target MPS threshold result in different muscle-related responses. Hypothetically, persons that consume more meals that elicit maximal MPS responses would have more favorable skeletal muscle-related outcomes (e.g., higher lean mass). In essence, these studies are assessing muscle-related outcomes by moving from a less to more optimal distribution. Two cross-sectional studies by Loenneke et al. [27] and Loprinzi et al. [28] used the same 1999–2002 National Health and Nutrition Examination Survey (NHANES) cohort to investigate the association between the number of meals containing ≥30 g of protein with leg lean mass and knee extensor strength. Participants were stratified into one of three groups: the referent group (0 meals containing ≥30 g protein, n = 341); 1 meal containing ≥30 g protein (n = 560); 2+ meals containing ≥30 g protein (n = 172). Loenneke et al. [27] and Loprinzi et al. [28] both reported that compared to 0 meals, consuming 1 or 2+ meals/d with ≥30 g of protein was associated with greater leg lean mass and knee extensor strength. Loprinzi et al. [28] further investigated whether there was a three-way interplay among moderate to vigorous physical activity and leisure time activities in combination with consuming meals containing ≥30 g of protein. Although activity levels were related to leg lean mass and strength, there was no evidence of a three-way interaction. Gayatán Gonález et al. [29] used the same study design with meal thresholds of ≥30 g and 0.4 g·kg−1. Compared to consuming 0 meals, consuming 2 or 3 meals per day, but not 1 meal, with adequate protein content was associated with lower risk of physical disability among 4 (30 g criterion) and 2 (0.4 g·kg−1 criterion) of the 15 outcomes assessed. Notably, the reference groups for each study [27,28,29] were consuming less than the recommended dietary allowance for protein. Conversely, the comparator groups (groups consuming 1 and 2+ meals/d above the thresholds) had relative protein intakes greater than 1.0 g·kg−1·d−1. Although total daily protein quantity was controlled for in the analyses, these results may reflect negative consequences of consuming less than the protein recommended dietary allowance on muscle mass and strength and not the benefits of frequently consuming moderately high-protein-containing meals.
A more recent analysis by Mishra et al. [30] using 2011–2014 NHANES data found that the grip strength of participants consuming ≥25 g of protein in at least one meal was not different compared to those consuming ≥25 g of protein at 2 and 3+ meals/d. These results are contradictory to those reported by Loenneke et al. [27] and Loprinzi et al. [28]. However, they both [27,28] referenced the group consuming 0 meals containing ≥30 g of protein, while Mishra et al. [30] referenced the group consuming at least 1 meal containing ≥25 g of protein. The total protein intakes of the groups consuming at least 1 meal containing ≥25 [30] or ≥30 g [27] of protein were comparable; each consumed 66–76 g·d−1 and ~78 g·d−1, respectively. It is possible that Mishra et al. [30] would have detected an association had they referenced the group consuming 0 meals that reached the target threshold. However, the low total protein intakes reported in this group would likely confound the results (~40 g·d−1); similar to the studies by Loenneke et al. [27] and Loprinzi et al. [28] (~45 g·d−1). Conversely, it is possible that Loenneke et al. [27] would not have reported an association had they used the group consuming at least 1 meal/d that reaches the target threshold as the comparator. Mishra et al. [30] also argued that because each study had a different primary outcome (leg lean mass and strength vs. hand grip strength), the conclusions may not be comparable. However, Valenzuela et al. [31], after adjusting for covariates (body weight, sex, and height), found appendicular lean mass was not different among participants from Northwestern Mexico who consumed no meals versus those who consumed at least one meal containing ≥25 g of protein. Similarly, Gingrich et al. [23] also found that the number of meals containing ≥0.4 g·kg−1 or ≥2.5 g leucine was not associated with leg strength, leg power, and hand grip strength.
Collectively, three [27,28,29] of six [23,27,28,29,30,31] studies demonstrated that consuming at least one meal that reaches a saturable dose limit is associated with a skeletal muscle-related outcome; however, these three studies [27,28,29] had reference groups consuming less than the protein recommended dietary allowance. Overall, these results indicate that compared to consuming marginal or inadequate protein quantity (<0.8 g·kg−1·d−1), consuming an unbalanced protein distribution with a higher-protein diet >1.0 g·kg−1·d−1, where at least one meal contains sufficient protein quantity to maximally stimulate MPS, is helpful to promote skeletal muscle health; consuming meals with “adequate” protein more frequently (i.e., moving from a unbalanced to an “optimal” protein distribution) was not associated with further skeletal muscle-related benefits.
2.3. Number of Meals Not Reaching a Target Threshold
In contrast to comparing the skeletal muscle-related outcomes among groups consuming incrementally more meals that reach a target threshold, the protein distribution concept can be approached by assessing the contrapositive: studying the deviation away from an optimal protein distribution. Gayatán Gonález et al. [32] assessed the separate relationships between subjective functionality scores and occasions in which protein intakes were less than either 30 g or 0.4 g·kg−1 at breakfast, lunch, or dinner, respectively. That is, they were assessing whether specific meals with “inadequate” protein were associated with functionality: does the meal in which protein “inadequacy” occurs matter? Using the 30 g criterion, inadequate protein intake at lunch was associated with both low and middle scores for activities of daily living. Using the 0.4 g·kg−1 criterion, only inadequate protein intake at dinner was associated with middle scores for instrumental activities of daily living. The authors [32] argued this relationship may exist because, among Mexican adults, lunch contributes the most protein towards total daily intakes: low protein intakes at lunch may promote consuming a lower total protein diet (information on total protein intakes were not available). However, even among younger adult Japanese men and women who were consuming greater than the protein recommended dietary allowance, total body fat-free mass percentage was greater in those that consumed ≥0.24 g·kg−1 at three meals compared to those that did not consume ≥0.24 g·kg−1 in at least one meal [33]. A difference in total protein intakes between groups makes it difficult to determine whether the more favorable fat-free mass status is a result of consuming either a balanced protein distribution or a higher-protein diet. The results from these two studies [32,33] apparently suggest that consuming a protein distribution that is anything less than “optimal” (i.e., where at least one meal contains “inadequate” protein) will be associated with poorer skeletal muscle-related outcomes. This would appear to suggest, based on the methods of the previous Section 2.2, that if the referent group was comprised of persons consuming 2 meals/d that reach a target threshold, then consuming 3 or more meals/day would be associated with more positive muscle-related outcomes. However, this is not readily apparent.
2.4. Conclusions from Observational Research
Collectively, the limited inconsistent results among the observational studies suggest that when total protein intakes are above 0.8 g·kg−1·d−1, consuming a relatively more balanced protein distribution may be superior to an unbalanced protein distribution to promote skeletal muscle-related outcomes. When total protein intakes are less than 0.8 g·kg−1·d−1 and more balanced, consuming a higher unbalanced protein distribution may be more favorable because at least one meal may contain sufficient protein to support muscle anabolism. However, encouraging people to consume a more balanced distribution may be advised to increase their total protein intakes at or above. 0.8 g/kg.
3. Randomized Controlled Research
3.1. Acute Protein Ingestion Research
Compared to consuming an unbalanced protein distribution, more proteins may be synthesized by consuming an optimal protein distribution; this seems intuitive: consuming more meals that stimulate a higher MPS rates should result in more synthesized muscle protein. To our knowledge, there are five acute studies that test the within-day protein distribution hypothesis (Table 2) [34,35,36,43,44]. The inaugural study performed in energy balance by Mamerow et al. [34] supports consuming a balanced protein distribution for a 25% higher aggregate MPS over 24 h, although findings from two studies by Kim et al. [35,43] and one by Murphy et al. [36] did not corroborate those results. Two more studies performed while participants were in energy restriction by Murphy et al. [36,44] report conflicting results: one showed that consuming a balanced versus unbalanced protein distribution resulted in ~19% higher MPS [36], while the other failed to reject the null hypothesis [44]. The results of the five acute studies are challenging to aggregate into a single conclusion because of the heterogeneity in participant characteristics, protein sources, and meal protein quantity. Each of these factors could arguably contribute to whether the study resulted in null or differential findings between balanced and unbalanced protein distributions.
Crudely, the protein distribution concept is supported when testing is performed during energy balance in younger [34], but not older [35,36,43], adults. The age of the participants studied is but one factor making it difficult to aggregate the results. Known as anabolic resistance, aging is associated with a disproportionate lesser increase in MPS to increasing intakes of dietary protein [10,45]. This phenomenon was documented in a retrospective analysis by Moore et al. [10]: compared to younger adults, the maximally effective dose of high-quality isolated intact protein to maximize MPS in older adults was ~70% higher. This information was relatively unknown when each of the studies presented here were developed. At the time, the sufficient dose of high-quality protein to maximize MPS, regardless of age, was thought to be 25–40 g [9,46,47,48]. Mamerow et al. [34] provided a 30 g dose of protein, based on their previous research [9], to their balanced group that may have been enough protein at each of the three meals to maximize MPS. Their unbalanced group may have only consumed one meal (dinner) that maximized MPS. In contrast, Kim et al. [35,43] and Murphy et al. [36] likely only provided a balanced protein distribution—not an optimal distribution. These results underscore the importance of tailoring the dose per meal of protein to achieve an optimal protein distribution to the age of the participants.
Apart from age, the inconsistent results could be explained by differences in both protein source and quantity, which consequently impact protein synthesis. In the retrospective analysis by Moore et al. [10], the saturable dose estimates were determined using studies on isolated intact proteins (i.e., protein supplements); these types of protein sources induce both higher peak plasma amino acid concentrations and faster time-to-peak concentration than whole foods [49,50,51]; this could positively impact their availability for influx to skeletal muscle to promote MPS [49,52]. In comparison, the saturable dose estimates were seemingly met by both Mamerow et al. [34] and Kim et al. [35,43] using whole foods. However, Mamerow et al. [34] reported a differential effect of protein distribution on MPS (25% higher in balanced vs. unbalanced) but Kim et al. [35,43] did not. Mamerow et al. [34] provided ~60% more protein than was estimated for their population’s saturable dose [10]. The protein doses used by Kim et al. [35,43] did not exceed the estimates to the same extent for their population. These results suggest that merely meeting a saturable dose estimate at each meal is not adequate. Rather, protein quality is also an important consideration, especially when consuming whole foods with plant and animal sources.
Even when consuming protein supplements, sufficient protein doses still need to be achieved. In energy balance, Murphy et al. [36] provided 25 g of an isolated intact protein—whey protein micellar. This was likely an insufficient dose for this cohort: to maximally stimulate MPS, they likely needed closer to ~40 g of high-quality protein per meal. Failure to either reach the target thresholds with protein supplements or exceed the thresholds with whole foods may explain the discordant results. However, the practicality of having adults consume protein in excess of 40 g in whole foods is up for debate [53].
In energy restriction, Murphy et al. [36,44] presented the only study that assessed the effect of protein distribution with or without resistance training. In their study using a primed, continuous intravenous infusion of an isotopically labelled amino acid, the authors reported that consuming a balanced distribution promoted ~19% higher MPS versus an unbalanced distribution [36]. Why did they find an effect of protein distribution in energy restriction, but not in energy balance? It may be that energy restriction “sensitizes” the muscle to changes in amino acid concentrations [54]; an increase in sensitivity could result in a greater increase between fasting and fed-state MPS at a given protein dose. Indeed, the magnitude of change in MPS from the fasting to fed state, although ultimately depressed with energy restriction, was greater in the balanced group than unbalanced group. However, when Murphy et al. [44] used an oral administration of deuterium oxide to measure bulk myofibrillar protein synthesis rates over two weeks of energy restriction, the results were not replicated. The authors speculated on several reasons for this. (1) Short-term laboratory measurements of MPS are sensitive to measuring acute responses to either feeding or exercise stimuli. Longer measures of MPS would inherently reflect variations in daily exposure to stressors. (2) The first study [36] was performed in the postprandial state only; the second study [44] included fasting rates in the calculations of fractional synthetic rates; this could have “diluted” the protein synthesis rates and masked the effect of protein distribution. (3) The first study included measurements of MPS in response to consuming three liquid meals, each containing 25 g of protein. The second study included participants consuming 1.3 g·kg−1·d−1 over four whole-food meals. As mentioned above, a blunted rise in postprandial plasma amino acid concentration from consuming whole-food protein sources, although protein intake was higher per meal, could have led to the discrepant results. Again, a higher protein dose may be needed with whole foods than with protein supplements.
The findings from Kim et al. [35,43] and Murphy et al. [36,44], although possibly statistically underpowered, are equally as intriguing as those presented by Mamerow et al. [34]. Despite reporting null results, their results suggest consuming an unbalanced protein distribution, where we assume at least one meal maximizes MPS, is comparable to consuming a balanced protein distribution that fails to reach the “target threshold” at each meal at intakes at and above the protein recommended dietary allowance.
3.1.1. Future Research Directions for Acute Protein Ingestion Research
While it is known that the quantity and quality of the protein consumed influences MPS, we still do not know the contribution of each individual postprandial MPS response to the daily synthesized protein pool. There are many stimuli that can affect MPS; under the most favorable feeding conditions, it is likely the anabolic effect of feeding only partially contributes to total daily protein synthesis. In laboratory settings, we assume the aggregate MPS response over the measurement period results from the sum of the individual postprandial MPS responses. The research by Mamerow et al. [34] suggest that altering the protein content within meals can impact MPS by a substantial margin in the laboratory, while the research by Murphy et al. [44] suggests this may not be the case in a free-living, community setting. This needs to be sufficiently reproduced before definitive conclusions can be drawn.
When performing these types of acute studies without titration, we do not know definitively when an individual or group of participants have maximized their ability to synthesize proteins; we only assume based on previous research under similar conditions. Consequently, we make evidenced-based assumptions when meals likely did not provide enough protein to meet or exceed the saturable dose estimates; often, this occurs as an explanation for why consuming a balanced protein distribution did not result in higher MPS rates. In practical terms, real-world meals typically contain a variety of whole-food animal- and plant-protein sources. While we have reasonable saturable dose estimates for isolated protein sources, future research should address how much protein is needed when consumed in a mixed meal with whole-food plant and animal protein sources. We could then design more ecologically valid studies to test whether an “optimal” protein distribution exists. By extension, we need studies in both younger and older cohorts; they should be designed to detect the potential for sexual dimorphisms; they should be tested in a range of energy balance states. Of course, while testing each of these factors in a single study would be ideal, it is likely not practical. With this in mind, we should strive for designing multiple studies with similar criteria to address these questions.
3.1.2. Conclusions from the Acute Protein Ingestion Research
When we consider the protein quantities within meals relative to the age of the participants within each study, it is clear that a cursory tallying of the results is not sufficient. Hindering a uniform conclusion, we have several studies reporting a null effect [35,36,43] pitted against the strongest evidence from a single study [34] supportive of the “optimal” protein distribution concept. Collectively, at present, convincing evidence is lacking from acute protein ingestion research to support or refute the hypothesis that optimizing protein intake among multiple daily main meals enhances MPS.
3.2. Chronic Protein Ingestion Research
The notion that the time of day, frequency, and distribution of daily dietary protein intake could influence protein metabolism dates back to the late 1930s. Researchers at the time manipulated dietary protein consumption frequency and distribution to effect (1) protein/amino acid balance and (2) nitrogen balance. These two balances are thought to be connected through the free amino acid pool. Constituting only a fraction of the total nitrogen pool, the free amino acid pool is maintained within narrow limits; therefore, when the body is in nitrogen balance (input = output), then we presume protein synthesis and breakdown are in balance [2]. However, nitrogen balance studies have their limitations [55,56,57,58,59,60]. With the advent of stable isotope amino acid methodologies, we can more accurately track the flux of amino acids in and out of tissues. Accordingly, the flux of amino acids from skeletal muscle and their incorporation into muscular proteins were emphasized in the 2000s to quantify protein synthetic rates in humans. Evidence from acute stable isotope studies provided cursory support for the within-day day protein distribution to impact skeletal muscle mass and function [34,35,36]. This prompted more research using prospective randomized controlled trial designs in which the relationship between protein distribution and skeletal muscle-related outcomes beyond acute changes in MPS could be further elucidated. This section will provide an in-depth analysis of the more valid nitrogen balance studies and of the more recent longitudinal randomized controlled trials on whole-body composition outcomes.
3.2.1. Nitrogen Balance
For most the 20th century, highly controlled nitrogen balance studies were considered the gold standard for studying protein metabolism; in fact, results from nitrogen balance studies still inform adult protein requirements [1]. Although recent protein metabolism research has emphasized the protein distribution concept, it was of scientific interest as early as 1939. The first study, to our knowledge, was performed using a single male participant by Cuthbertson and Munro [61]. Their initial research was focused on understanding the relationship between carbohydrate and protein metabolism; this inevitably led them to studying the effect of the within-day protein intake frequency—a form of protein distribution. Since their initial research, the effect of protein distribution on nitrogen balance has been studied at least 11 more times [7,38,39,61,62,63,64,65,66,67,68,69]. Many of these studies, however, do not sufficiently meet the criteria for a valid nitrogen balance experiment [70] (e.g., appropriate stabilization periods; periods consuming the controlled diets must be long enough; corrections for integumental and miscellaneous losses; urine and fecal collections must be precisely timed and complete). Considering the evidence in light of these criteria, we considered only two of the 12 studies—one study shows an effect of protein distribution [38] and the other shows that protein distribution does not influence nitrogen balance [39,62] (Table 3).
Arnal et al. [38] were the first to study protein distribution in older women. Participants were randomized to consume either 80% of their protein at lunch (unbalanced) or a more balanced protein distribution pattern (21:31:19:28% protein/meal). After 14 d, the unbalanced group had a more positive nitrogen balance and a maintenance of fat-free mass; fat-free mass slightly decreased (~−0.3 kg) in the balanced group. This was attributed to the greater 24 h whole-body protein synthesis in the unbalanced group than the balanced group, although fed-state protein synthesis rates were not different. The same study design was replicated in younger women by the same group [39]. However, this time the authors reported no difference between groups in whole-body fat-free mass, protein turnover, and protein synthesis and breakdown. While there was no statistically supported difference in whole-body nitrogen balance, nitrogen retention was 1.5 times higher with the balanced vs unbalanced distribution (p = 0.16). The authors highlight the difference in nitrogen balance between groups was 23 mg N·kg fat-free mass−1·d−1 (balanced > unbalanced); this was similar in magnitude to the difference reported in the older females (27 mg N·kg fat-free mass−1·d−1; balanced < unbalanced) [38,39].
These results from Arnal et al. [38,39] are consistent with an anabolic resistance to feeding commonly observed among older adults. Although four balanced meals were consumed, the quantity of protein at each meal may have been too low to maximally, or at least meaningfully, stimulate MPS [38], i.e., they consumed a balanced but not optimal protein distribution. Conversely, while consuming the unbalanced protein distribution, participants likely maximized MPS after the lunch meal. Even if MPS after lunch was not maximized, these results that suggest aggregate protein synthesis was higher after consuming an unbalanced distribution pattern that likely maximized MPS at least once. Among younger adults who are more “sensitive” to dietary protein/amino acid intake, the lower protein doses consumed in a balanced protein distribution likely triggered a more robust anabolic response to feeding [39]. The postprandial MPS responses while consuming the unbalanced distribution likely were not greatly affected; the maximum achievable MPS rate is not different between younger and older adults [71]; therefore, the MPS responses between groups after lunch were likely comparable.
3.2.2. Body Composition
Acute human clinical studies often provide the foundational science used to design longitudinal studies. Longitudinal randomized controlled trials have the benefit of inherently capturing daily fluctuations in hormonal concentrations, energy intakes, and exposure to stress; these factors can have profound impacts on both phenotypical and functional outcomes. Chronic feeding studies are necessary to assess the applicability and efficacy of acute studies in real-world settings. Only five longitudinal studies to date (to our knowledge) have investigated the effect of protein distribution on body composition [43,62,72,73,74]. One study supports consuming a balanced protein distribution [73], three report null results [43,62,74], and one supports consuming an unbalanced distribution for lean mass gains [72] (Table 4).
Among all randomized controlled trials, only one study supports consuming a balanced protein distribution to support lean mass gains [73]. In this study, Yasuda et al. [73] tested the effect of providing participants with either a low or high-protein breakfast. The high-protein breakfast was achieved by the addition of a protein supplement; the same supplement was consumed at dinner by the low-protein breakfast group. Both groups experienced resistance-training induced increases in lean body mass over time; however, the increases tended to be greater in the high-protein breakfast group (2.5 ± 0.3 kg vs. 1.8 ± 0.3 kg; p = 0.056); there was no effect on appendicular lean mass changes. Notably, the balanced group (high-protein breakfast) had a lower total protein intake (1.3 g·kg−1·d−1) than the unbalanced group (lower-protein breakfast; g·kg−1·d−1). However, due to small samples sizes in both groups, albeit a large effect size (d = 0.7), this study is likely more proof of concept. Only one other study [74] seemingly provided enough protein per meal to be considered an “optimal” distribution pattern; however, contrary to Yasuda et al. [73], Hudson et al. [74] did not report an effect of protein distribution on lean mass changes. Based on the research by Mamerow et al. [34], Hudson et al. [74] prescribed 30 g of protein per meal (~0.3 g·kg−1·meal−1); this should have provided a “safety margin” of ~0.1 g·kg−1 [10]. As mentioned in the acute protein ingestion section above, their estimates are based on studies utilizing isolated intact proteins [10]. Mixed-nutrient meals, analogous to the one meal by Hudson et al. [74], contain multiple whole-food protein sources; the variability in protein quality and the difference in food matrices alters the protein digestion and amino acid absorption kinetics compared with protein supplements [49]. Underscoring this point, Kim et al. [43] found that peak plasma leucine concentrations after consuming a whole-food meal were less than 50% of the peak concentration achieved from consuming an essential amino acids mixture containing twice the leucine quantity. Compared to a supplement, the protein quantity within mixed-nutrient meals likely needs to be greater. Yasuda et al. [73] prescribed a protein supplement, in addition to the standardized whole-food breakfast, to attain the higher-protein meal. Sufficient quantity (0.33 g·kg−1) and quality (whole foods and supplement) may have been adequate to achieve a saturable dose and promote an optimal distribution. Although Hudson et al. [74] prescribed a balanced protein distribution, they may not have prescribed an “optimal” protein distribution due to the quality of protein consumed in the mixed meals. Conversely, the unbalanced protein distribution may have provided the protein dose required to stimulate MPS maximally after dinner; the result may have been comparable daily synthesis rates. The same reasoning could be used to explain the null results among the two other studies [43,62]: they prescribed balanced but not “optimal” protein distribution patterns. These arguments, however, are only conjecture; none of the studies measured postprandial MPS rates.
The research by Bouillanne et al. [72] in hospitalized older adults showed that consuming an unbalanced protein distribution supported lean mass gains, while consuming a balanced protein distribution resulted in a loss of lean mass. Similarly, Hudson et al. [74] found younger adults in energy restriction trended (p = 0.067) towards losing less lean mass when they consumed an unbalanced protein distribution (−0.5 kg) versus consuming a balanced protein distribution (−1.5 kg). These results [72,74] seemingly agree with the observational results from Loenneke et al. [27] and Loprinzi et al. [28] and the nitrogen balance data provided by Arnal et al. [38]: consuming ≥1 meal with sufficient protein to theoretically maximize MPS may be better for lean body mass retention than consuming three balanced meals with “insufficient” protein to be considered optimal.
While protein quantity within meals may partially explain the null results, the interplay between the anticipated effect size and the studies durations could provide further context. Per annuum, lean mass decreases by approximately 1%–2% on average in adults who typically consume an unbalanced protein distribution [75,76]. We assume the “best-case scenario” for consuming a balanced protein distribution in adults not purposefully altering their body composition over the year would be a retention of lean mass. The amount of lean mass possibly retained over 12 months, being relatively small, is difficult to detect with current techniques. Measuring a differential change between groups who retained and who lost lean mass over 2–4 months, the length of the studies presented here, may be even less feasible. Aligning with this, Kim et al. [43] hypothesized that consuming a balanced vs unbalanced protein distribution over 8 weeks would increase lean mass [77]; however, they showed that lean mass did not differentially change. Even with weight loss interventions, where lean mass loss is expected, both Adechian et al. [62] and Hudson et al. [74] reported that lean mass did not differentially change between groups who were energy-restricted even though the interventions were longer. Bouillanne et al. [72] reported differential lean mass changes after only 6 wk; however, they studied a hospitalized, malnourished population. Among a population experiencing lean mass loss above the 1%–2% rate, an effect of protein distribution may be measurable with our current techniques under “shorter” durations.
An exercise stressor has been proposed to provide the “optimal environment” for protein distribution to induce differential changes in lean mass, including skeletal muscle, over a few months. Compared to protein ingestion while being sedentary, resistance training “sensitizes” the muscle to promote greater MPS [47]. Theoretically, consuming a balanced distribution of protein among daily meals would stimulate MPS more frequently, in turn enhancing resistance training-induced lean mass and muscle accretion [44]. An alternative hypothesis is that manipulating dietary protein distribution concurrently with resistance training would not influence lean mass and muscle accretion because the anabolic effect of resistance training is superior to the relatively less robust effect of protein distribution [78]. No study to date has directly tested these opposing hypotheses regarding body composition.
As discussed, postprandial MPS partly determines changes in the skeletal muscle protein pool; however, we must acknowledge that both acute and chronic studies have several limitations. First, skeletal muscle changes in response to repeated exposures to both catabolic and anabolic stressors. These stressors include, but are not limited to, hormonal concentrations, energy status, and exercise training status. Their influence on lean mass changes cannot be accurately predicted from acute studies because they fluctuate and persist beyond the durations measured in laboratory settings. Second, the saturable dose estimates were established by sampling a single muscle—the vastus lateralis. While MPS does not vary by either anatomic location or fiber type [79], lean mass is not solely composed of skeletal muscle. Changes in lean mass also reflect changes in organ tissues and water. Third, hydration status can have a particularly profound influence on lean mass because water fluctuates to a greater magnitude than the muscle protein pool. In an attempt to improve the congruence between lean mass and skeletal muscle, a four-compartment model of body composition was developed to factor-in fluctuation in total body water [80,81]. This would get us closer to measuring changes in the protein pool alone. Another viable alternative to estimating changes in the protein content of skeletal muscle is to measure appendicular lean mass. The appendicular regions have more congruence with skeletal muscle than whole-body lean mass for the following: it is devoid of organs, is less prone to major fluctuations in body water, and is comprised primarily of skeletal muscle. However, surrogate markers of the skeletal muscle protein pool should always be interpreted with caution.
3.2.3. Future Research Directions for Chronic Protein Ingestion Research
We argued that the lack of evidence in support of an optimal protein distribution may be explained by both inadequate protein quantity and quality within meals; this resulted in balanced but not optimal protein distributions. The saturable dose estimates we used to critique meal protein quantity are based on isolated intact proteins. However, importantly, the vast majority of protein consumed comes from protein-rich foods, not supplements. Establishing the relative saturable doses using whole-food animal- and plant-protein sources will facilitate conducting optimal distribution studies while participants consume varied protein-rich foods.
Recommendations in the scientific literature are made for older adults to consume 0.4–0.6 g·kg−1·meal−1 to promote muscle retention [82]. This equates to 1.2–1.8 g·kg−1·d−1, which is 50% to 125% higher than the recommended dietary allowance and ~15% to 110% higher than the average daily protein intake amongst older adult men and women [19]. Currently, there is no direct evidence from randomized controlled trials to support consuming 1.2–1.8 g·kg−1·d−1 in a balanced protein distribution to promote muscle size, strength or quality. There is evidence these quantities of protein intake do promote beneficial changes in lean mass; however, this is compared to consuming lower-protein diets [83,84,85,86]. In these studies, the higher protein intakes may have been achieved by pragmatically adding the additional protein to breakfast and lunch; the dinner meal may not have been a good candidate for additional protein because it is usually the largest protein-containing meal. Therefore, it is possible we have evidence that a balanced higher-protein diet is more beneficial for lean mass than consuming an unbalanced lower/normal protein diet. We currently lack sufficient evidence to determine the effect of protein distribution on lean mass when total protein intake is matched at either lower or higher protein intakes.
Arguably, research designed to measure muscular function outcomes may be more meaningful than those measuring lean mass. Skeletal muscle strength and function, rather than mass, is often associated with health and longevity among aging adults [87]. Shifting our research focus away from measuring mass and towards assessing function may be the future of protein ingestion research.
3.2.4. Conclusions from Chronic Protein Ingestion Research
While balanced versus unbalanced protein distributions have been experimentally tested, there is likely only one study assessing an “optimal” protein distribution [73]. The distinction between balanced and “optimal” protein distribution is an important one. Collectively, the results suggest that consuming an unbalanced protein distribution with at least one high-protein meal/d may be equally or more beneficial than a balanced, but not optimal, protein distribution on lean mass. Consuming a diet with both a balanced and optimal protein distribution pattern may confer advantages over an unbalanced distribution on lean mass gains.
4. Conclusions—Does the Evidence Support the Concept?
There seems to be a valid theoretical rationale to optimize protein distribution to influence muscle-related outcomes. However, the current available evidence is too limited and inconsistent to make a definitive conclusion about whether changing dietary patterns from consuming an unbalanced distribution to consuming an “optimal” protein distribution pattern will positively influence muscle-related outcomes. The underlying rationale for promoting an optimal protein distribution throughout the day remains intriguing but, from the available literature, it appears more important to ensure adequate total daily protein intake. Because typical protein distribution patterns are skewed towards the dinner meal, encouraging adults, especially older adults with marginal or inadequate protein intakes (<0.80 g·kg−1·d−1), to better balance their daily protein intake, by consuming more protein at breakfast and lunch meals, may be a practical way to achieve a moderately higher total protein diet and promote skeletal muscle health. However, recommending individuals who consume a low-protein diet to balance protein distribution without increasing their total protein intake to become adequate is ill-advised. Among individuals who consume adequate total protein (0.8–1.3 g·kg−1·d−1), the preponderance of evidence suggests that consuming at least one high-protein meal per day may be sufficient to support skeletal muscle-related outcomes even if the distribution is unbalanced.
Author Contributions
Conceptualization, J.L.H.; Writing—Original Draft Preparation, J.L.H.; Writing—Review & Editing, R.E.B.III and W.W.C. All authors have read and agreed to the published version of the manuscript.
Funding
This research received no external funding.
Conflicts of Interest
The authors declare no conflict of interest.
References
- Institute of Medicine. Panel on Macronutrients. In Dietary Reference Intakes for Energy, Carbohydrate, Fiber, Fat, Fatty Acids, Cholesterol, Protein, and Amino Acids (Macronutrients); National Academies Press: Washington, DC, USA, 2004. [Google Scholar]
- Waterlow, J.C.; Garlick, P.J.; Mill Ward, D. Protein Turnover in Mammalian Tissues and in the Whole Body; Elsevier/North-Holland Biomedical Press: Amsterdam, The Netherlands, 1978. [Google Scholar]
- Geiger, E. Experiments with delayed supplementation of incomplete amino acid mixtures. J. Nutr. 1947, 34, 97–111. [Google Scholar] [CrossRef] [PubMed]
- Cannon, P.R.; Steffee, C.H. The influence of time of ingestion of essential amino acid upon utilization in tissue-synthesis. Fed. Proc. 1947, 6, 390. [Google Scholar] [PubMed]
- Henry, K.M.; Kon, S.K. 337. The supplementary relationships between the proteins of dairy products and those of bread and potato as affected by the method of feeding. With a note on the value of soya-bean protein. J. Dairy Res. 1946, 14, 330–339. [Google Scholar] [CrossRef]
- Harte, R.A.; Travers, J.J.; Sarich, P. Voluntary caloric intake of the growing rat. J. Nutr. 1948, 36, 667–679. [Google Scholar] [CrossRef] [PubMed]
- Leverton, R.M.; Gram, M.R. Nitrogen excretion of women related to the distribution of animal protein in daily meals. J. Nutr. 1949, 39, 57–65. [Google Scholar] [CrossRef]
- Rennie, M.J.; Wackerhage, H.; Spangenburg, E.E.; Booth, F.W. Control of the size of the human muscle mass. Annu. Rev. Physiol. 2004, 66, 799–828. [Google Scholar] [CrossRef] [PubMed]
- Symons, T.B.; Sheffield-Moore, M.; Wolfe, R.R.; Paddon-Jones, D. A moderate serving of high-quality protein maximally stimulates skeletal muscle protein synthesis in young and elderly subjects. J. Am. Diet. Assoc. 2009, 109, 1582–1586. [Google Scholar] [CrossRef] [Green Version]
- Moore, D.R.; Churchward-Venne, T.A.; Witard, O.; Breen, L.; Burd, N.A.; Tipton, K.D.; Phillips, S.M. Protein ingestion to stimulate myofibrillar protein synthesis requires greater relative protein intakes in healthy older versus younger men. J. Gerontol. A Biol. Sci. Med. Sci. 2015, 70, 57–62. [Google Scholar] [CrossRef] [Green Version]
- Deutz, N.E.; Wolfe, R.R. Is there a maximal anabolic response to protein intake with a meal? Clin. Nutr. 2013, 32, 309–313. [Google Scholar] [CrossRef] [Green Version]
- Kim, I.Y.; Deutz, N.E.P.; Wolfe, R.R. Update on maximal anabolic response to dietary protein. Clin. Nutr. 2018, 37, 411–418. [Google Scholar] [CrossRef]
- Gillen, J.B.; Trommelen, J.; Wardenaar, F.C.; Brinkmans, N.Y.; Versteegen, J.J.; Jonvik, K.L.; Kapp, C.; de Vries, J.; van den Borne, J.J.; Gibala, M.J.; et al. Dietary Protein Intake and Distribution Patterns of Well-Trained Dutch Athletes. Int. J. Sport Nutr. Exerc. Metab. 2017, 27, 105–114. [Google Scholar] [CrossRef] [PubMed]
- Tieland, M.; Borgonjen-Van den Berg, K.J.; van Loon, L.J.; de Groot, L.C. Dietary protein intake in community-dwelling, frail, and institutionalized elderly people: Scope for improvement. Eur. J. Nutr. 2012, 51, 173–179. [Google Scholar] [CrossRef] [PubMed]
- U.S. Department of Agriculture. Nutrient Intakes from Food: Mean Amounts Consumed per Individual, by Gender and Age, What We Eat in America, NHANES 2009–2010; Agricultural Research Service: Washington, DC, USA, 2012.
- Brinkmans, N.Y.J.; Iedema, N.; Plasqui, G.; Wouters, L.; Saris, W.H.M.; van Loon, L.J.C.; van Dijk, J.W. Energy expenditure and dietary intake in professional football players in the Dutch Premier League: Implications for nutritional counselling. J. Sports Sci. 2019, 37, 2759–2767. [Google Scholar] [CrossRef] [PubMed]
- Smeuninx, B.; Greig, C.A.; Breen, L. Amount, Source and Pattern of Dietary Protein Intake Across the Adult Lifespan: A Cross-Sectional Study. Front. Nutr. 2020, 7, 25. [Google Scholar] [CrossRef]
- Tieland, M.; Borgonjen-Van den Berg, K.J.; Van Loon, L.J.; de Groot, L.C. Dietary Protein Intake in Dutch Elderly People: A Focus on Protein Sources. Nutrients 2015, 7, 9697–9706. [Google Scholar] [CrossRef]
- Berner, L.A.; Becker, G.; Wise, M.; Doi, J. Characterization of Dietary Protein among Older Adults in the United States: Amount, Animal Sources, and Meal Patterns. J. Acad. Nutr. Diet. 2013, 113, 809–815. [Google Scholar] [CrossRef]
- Cardon-Thomas, D.K.; Riviere, T.; Tieges, Z.; Greig, C.A. Dietary Protein in Older Adults: Adequate Daily Intake but Potential for Improved Distribution. Nutrients 2017, 9, 184. [Google Scholar] [CrossRef]
- Rousset, S.; Patureau Mirand, P.; Brandolini, M.; Martin, J.F.; Boirie, Y. Daily protein intakes and eating patterns in young and elderly French. Br. J. Nutr. 2003, 90, 1107–1115. [Google Scholar] [CrossRef] [Green Version]
- Bollwein, J.; Diekmann, R.; Kaiser, M.J.; Bauer, J.M.; Uter, W.; Sieber, C.C.; Volkert, D. Distribution but not amount of protein intake is associated with frailty: A cross-sectional investigation in the region of Nurnberg. Nutr. J. 2013, 12, 109. [Google Scholar] [CrossRef] [Green Version]
- Gingrich, A.; Spiegel, A.; Kob, R.; Schoene, D.; Skurk, T.; Hauner, H.; Sieber, C.C.; Volkert, D.; Kiesswetter, E. Amount, Distribution, and Quality of Protein Intake Are Not Associated with Muscle Mass, Strength, and Power in Healthy Older Adults without Functional Limitations-An enable Study. Nutrients 2017, 9, 1358. [Google Scholar] [CrossRef] [Green Version]
- Ten Haaf, D.S.M.; van Dongen, E.J.I.; Nuijten, M.A.H.; Eijsvogels, T.M.H.; de Groot, L.; Hopman, M.T.E. Protein Intake and Distribution in Relation to Physical Functioning and Quality of Life in Community-Dwelling Elderly People: Acknowledging the Role of Physical Activity. Nutrients 2018, 10, 506. [Google Scholar] [CrossRef] [PubMed] [Green Version]
- Farsijani, S.; Morais, J.A.; Payette, H.; Gaudreau, P.; Shatenstein, B.; Gray-Donald, K.; Chevalier, S. Relation between mealtime distribution of protein intake and lean mass loss in free-living older adults of the NuAge study. Am. J. Clin. Nutr. 2016, 104, 694–703. [Google Scholar] [CrossRef] [PubMed]
- Farsijani, S.; Payette, H.; Morais, J.A.; Shatenstein, B.; Gaudreau, P.; Chevalier, S. Even mealtime distribution of protein intake is associated with greater muscle strength, but not with 3-y physical function decline, in free-living older adults: The Quebec longitudinal study on Nutrition as a Determinant of Successful Aging (NuAge study). Am. J. Clin. Nutr. 2017, 106, 113–124. [Google Scholar] [CrossRef] [PubMed]
- Loenneke, J.P.; Loprinzi, P.D.; Murphy, C.H.; Phillips, S.M. Per meal dose and frequency of protein consumption is associated with lean mass and muscle performance. Clin. Nutr. 2016. [Google Scholar] [CrossRef]
- Loprinzi, P.D.; Loenneke, J.P.; Hamilton, D.L. Leisure time sedentary behavior, physical activity and frequency of protein consumption on lower extremity strength and lean mass. Eur. J. Clin. Nutr. 2017, 71, 1399–1404. [Google Scholar] [CrossRef]
- Gaytán-González, A.; Ocampo-Alfaro, M.D.J.; Torres-Naranjo, F.; Arroniz-Rivera, M.; González-Mendoza, R.G.; Gil-Barreiro, M.; López-Taylor, J.R. The Consumption of Two or Three Meals per Day with Adequate Protein Content Is Associated with Lower Risk of Physical Disability in Mexican Adults Aged 60 Years and Older. Geriatrics 2020, 5, 1. [Google Scholar] [CrossRef] [Green Version]
- Mishra, S.; Goldman, J.D.; Sahyoun, N.R.; Moshfegh, A.J. Association between dietary protein intake and grip strength among adults aged 51 years and over: What We Eat in America, National Health and Nutrition Examination Survey 2011–2014. PLoS ONE 2018, 13, e0191368. [Google Scholar] [CrossRef] [Green Version]
- Valenzuela, R.E.R.; Ponce, J.A.; Morales-Figueroa, G.G.; Muro, K.A.; Carreón, V.R.; Alemán-Mateo, H. Insufficient amounts and inadequate distribution of dietary protein intake in apparently healthy older adults in a developing country: Implications for dietary strategies to prevent sarcopenia. Clin. Interv. Aging 2013, 8, 1143–1148. [Google Scholar] [CrossRef] [Green Version]
- Gaytan-Gonzalez, A.; Ocampo-Alfaro, M.J.; Arroniz-Rivera, M.; Torres-Naranjo, F.; Gonzalez-Mendoza, R.G.; Gil-Barreiro, M.; Lopez-Taylor, J.R. Inadequate Protein Intake at Specific Meals Is Associated with Higher Risk of Impaired Functionality in Middle to Older Aged Mexican Adults. J. Aging Res. 2019, 2019, 6597617. [Google Scholar] [CrossRef] [Green Version]
- Yasuda, J.; Asako, M.; Arimitsu, T.; Fujita, S. Association of Protein Intake in Three Meals with Muscle Mass in Healthy Young Subjects: A Cross-Sectional Study. Nutrients 2019, 11, 612. [Google Scholar] [CrossRef] [Green Version]
- Mamerow, M.M.; Mettler, J.A.; English, K.L.; Casperson, S.L.; Arentson-Lantz, E.; Sheffield-Moore, M.; Layman, D.K.; Paddon-Jones, D. Dietary protein distribution positively influences 24-h muscle protein synthesis in healthy adults. J. Nutr. 2014, 144, 876–880. [Google Scholar] [CrossRef] [PubMed] [Green Version]
- Kim, I.Y.; Schutzler, S.; Schrader, A.; Spencer, H.; Kortebein, P.; Deutz, N.E.; Wolfe, R.R.; Ferrando, A.A. Quantity of dietary protein intake, but not pattern of intake, affects net protein balance primarily through differences in protein synthesis in older adults. Am. J. Physiol. Endocrinol. Metab. 2015, 308, E21–E28. [Google Scholar] [CrossRef] [PubMed]
- Murphy, C.H.; Churchward-Venne, T.A.; Mitchell, C.J.; Kolar, N.M.; Kassis, A.; Karagounis, L.G.; Burke, L.M.; Hawley, J.A.; Phillips, S.M. Hypoenergetic diet-induced reductions in myofibrillar protein synthesis are restored with resistance training and balanced daily protein ingestion in older men. Am. J. Physiol. Endocrinol. Metab. 2015, 308, E734–E743. [Google Scholar] [CrossRef] [PubMed] [Green Version]
- El-Khoury, A.E.; Sanchez, M.; Fukagawa, N.K.; Gleason, R.E.; Tsay, R.H.; Young, V.R. The 24-h kinetics of leucine oxidation in healthy adults receiving a generous leucine intake via three discrete meals. Am. J. Clin. Nutr. 1995, 62, 579–590. [Google Scholar] [CrossRef]
- Arnal, M.A.; Mosoni, L.; Boirie, Y.; Houlier, M.L.; Morin, L.; Verdier, E.; Ritz, P.; Antoine, J.M.; Prugnaud, J.; Beaufrere, B.; et al. Protein pulse feeding improves protein retention in elderly women. Am. J. Clin. Nutr. 1999, 69, 1202–1208. [Google Scholar] [CrossRef] [Green Version]
- Arnal, M.A.; Mosoni, L.; Boirie, Y.; Houlier, M.L.; Morin, L.; Verdier, E.; Ritz, P.; Antoine, J.M.; Prugnaud, J.; Beaufrere, B.; et al. Protein feeding pattern does not affect protein retention in young women. J. Nutr. 2000, 130, 1700–1704. [Google Scholar] [CrossRef] [Green Version]
- Phillips, S.M.; Tipton, K.D.; Aarsland, A.; Wolf, S.E.; Wolfe, R.R. Mixed muscle protein synthesis and breakdown after resistance exercise in humans. Am. J. Physiol. Endocrinol. Metab. 1997, 273, E99–E107. [Google Scholar] [CrossRef]
- Fried, L.P.; Tangen, C.M.; Walston, J.; Newman, A.B.; Hirsch, C.; Gottdiener, J.; Seeman, T.; Tracy, R.; Kop, W.J.; Burke, G.; et al. Frailty in older adults: Evidence for a phenotype. J. Gerontol. A Biol. Sci. Med. Sci. 2001, 56, M146–M156. [Google Scholar] [CrossRef]
- Janssen, I.; Heymsfield, S.B.; Baumgartner, R.N.; Ross, R. Estimation of skeletal muscle mass by bioelectrical impedance analysis. J. Appl. Physiol. (1985) 2000, 89, 465–471. [Google Scholar] [CrossRef] [Green Version]
- Kim, I.-Y.; Schutzler, S.; Schrader, A.M.; Spencer, H.J.; Azhar, G.; Wolfe, R.R.; Ferrando, A.A. Protein intake distribution pattern does not affect anabolic response, lean body mass, muscle strength or function over 8 weeks in older adults: A randomized-controlled trial. Clin. Nutr. 2018, 37, 488–493. [Google Scholar] [CrossRef]
- Murphy, C.H.; Shankaran, M.; Churchward-Venne, T.A.; Mitchell, C.J.; Kolar, N.M.; Burke, L.M.; Hawley, J.A.; Kassis, A.; Karagounis, L.G.; Li, K.; et al. Effect of resistance training and protein intake pattern on myofibrillar protein synthesis and proteome kinetics in older men in energy restriction. J. Physiol. 2018, 596, 2091–2120. [Google Scholar] [CrossRef] [PubMed] [Green Version]
- Burd, N.A.; Gorissen, S.H.; Van Loon, L.J.C. Anabolic Resistance of Muscle Protein Synthesis with Aging. Exerc. Sport Sci. Rev. 2013, 41, 169–173. [Google Scholar] [CrossRef] [PubMed]
- Robinson, M.J.; Burd, N.A.; Breen, L.; Rerecich, T.; Yang, Y.; Hector, A.J.; Baker, S.K.; Phillips, S.M. Dose-dependent responses of myofibrillar protein synthesis with beef ingestion are enhanced with resistance exercise in middle-aged men. Appl. Physiol. Nutr. Metab. 2013, 38, 120–125. [Google Scholar] [CrossRef] [PubMed] [Green Version]
- Yang, Y.; Breen, L.; Burd, N.A.; Hector, A.J.; Churchward-Venne, T.A.; Josse, A.R.; Tarnopolsky, M.A.; Phillips, S.M. Resistance exercise enhances myofibrillar protein synthesis with graded intakes of whey protein in older men. Br. J. Nutr. 2012, 108, 1780–1788. [Google Scholar] [CrossRef] [PubMed] [Green Version]
- Pennings, B.; Groen, B.; de Lange, A.; Gijsen, A.P.; Zorenc, A.H.; Senden, J.M.; van Loon, L.J. Amino acid absorption and subsequent muscle protein accretion following graded intakes of whey protein in elderly men. Am. J. Physiol. Endocrinol. Metab. 2012, 302, E992–E999. [Google Scholar] [CrossRef] [PubMed] [Green Version]
- Hudson, J.L.; Paddon-Jones, D.; Campbell, W.W. Whey protein supplementation 2 hours after a lower protein breakfast restores plasma essential amino acid availability comparable to a higher protein breakfast in overweight adults. Nutr. Res. 2017, 47, 90–97. [Google Scholar] [CrossRef] [PubMed]
- Burke, L.M.; Winter, J.A.; Cameron-Smith, D.; Enslen, M.; Farnfield, M.; Decombaz, J. Effect of Intake of Different Dietary Protein Sources on Plasma Amino Acid Profiles at Rest and After Exercise. Int. J. Sport Nutr. Exerc. Metab. 2012, 22, 452–462. [Google Scholar] [CrossRef] [Green Version]
- Conley, T.B.; Apolzan, J.W.; Leidy, H.J.; Greaves, K.A.; Lim, E.; Campbell, W.W. Effect of food form on postprandial plasma amino acid concentrations in older adults. Br. J. Nutr. 2011, 106, 203–207. [Google Scholar] [CrossRef]
- West, D.W.; Burd, N.A.; Coffey, V.G.; Baker, S.K.; Burke, L.M.; Hawley, J.A.; Moore, D.R.; Stellingwerff, T.; Phillips, S.M. Rapid aminoacidemia enhances myofibrillar protein synthesis and anabolic intramuscular signaling responses after resistance exercise. Am. J. Clin. Nutr. 2011, 94, 795–803. [Google Scholar] [CrossRef] [Green Version]
- Howarth, N.C.; Huang, T.T.; Roberts, S.B.; Lin, B.H.; McCrory, M.A. Eating patterns and dietary composition in relation to BMI in younger and older adults. Int. J. Obes. (Lond.) 2007, 31, 675–684. [Google Scholar] [CrossRef] [Green Version]
- Hector, A.J.; McGlory, C.; Damas, F.; Mazara, N.; Baker, S.K.; Phillips, S.M. Pronounced energy restriction with elevated protein intake results in no change in proteolysis and reductions in skeletal muscle protein synthesis that are mitigated by resistance exercise. FASEB J. 2018, 32, 265–275. [Google Scholar] [CrossRef] [PubMed] [Green Version]
- Tomé, D.; Bos, C.C. Dietary Protein and Nitrogen Utilization. J. Nutr. 2000, 130, 1868S–1873S. [Google Scholar] [CrossRef] [PubMed]
- World Health Organization. Energy and protein requirements. In Report of a Joint FAO/WHO/UNU Expert Consultation; World Health Organization Technical Report Series; World Health Organization: Geneva, Switzerland, 1985; Volume 724, pp. 1–206. [Google Scholar]
- Hegsted, D.M. Balance Studies. J. Nutr. 1976, 106, 307–311. [Google Scholar] [CrossRef]
- Waterlow, J.C. The mysteries of nitrogen balance. Nutr. Res. Rev. 1999, 12, 25–54. [Google Scholar] [CrossRef] [PubMed] [Green Version]
- Young, V.R. Nutritional balance studies: Indicators of human requirements or of adaptive mechanisms? J. Nutr. 1986, 116, 700–703. [Google Scholar] [CrossRef]
- Millward, D.J. Methodological considerations. Proc. Nutr. Soc. 2001, 60, 3–5. [Google Scholar] [CrossRef] [Green Version]
- Cuthbertson, D.P.; Munro, H.N. The relationship of carbohydrate metabolism to protein metabolism: The roles of total dietary carbohydrate and of surfeit carbohydrate in protein metabolism. Biochem. J. 1939, 33, 128–142. [Google Scholar] [CrossRef] [Green Version]
- Adechian, S.; Balage, M.; Remond, D.; Migne, C.; Quignard-Boulange, A.; Marset-Baglieri, A.; Rousset, S.; Boirie, Y.; Gaudichon, C.; Dardevet, D.; et al. Protein feeding pattern, casein feeding, or milk-soluble protein feeding did not change the evolution of body composition during a short-term weight loss program. Am. J. Physiol. Endocrinol. Metab. 2012, 303, E973–E982. [Google Scholar] [CrossRef] [Green Version]
- Bortz, W.M.; Wroldsen, A.; Issekutz, B., Jr.; Rodahl, K. Weight loss and frequency of feeding. N. Engl. J. Med. 1966, 274, 376–379. [Google Scholar] [CrossRef]
- Irwin, M.I.; Feeley, R.M. Frequency and size of meals and serum lipids, nitrogen and mineral retention, fat digestibility, and urinary thiamine and riboflavin in young women. Am. J. Clin. Nutr. 1967, 20, 816–824. [Google Scholar] [CrossRef]
- Leverton, R.M.; Gram, M.R.; Chaloupka, M. Effect of the time factor and calorie level on nitrogen utilization of young women. J. Nutr. 1951, 44, 537–545. [Google Scholar] [CrossRef] [PubMed]
- Swindells, Y.E.; Holmes, S.A.; Robinson, M.F. The metabolic response of young women to changes in the frequency of meals. Br. J. Nutr. 1968, 22, 667–680. [Google Scholar] [CrossRef] [PubMed] [Green Version]
- Taylor, Y.S.; Young, V.R.; Murray, E.; Pencharz, P.B.; Scrimshaw, N.S. Daily protein and meal patterns affecting young men fed adequate and restricted energy intakes. Am. J. Clin. Nutr. 1973, 26, 1216–1223. [Google Scholar] [CrossRef] [PubMed]
- Wu, H.; Wu, D.Y. Influence of feeding schedule on nitrogen utilization and excretion. Proc. Soc. Exp. Biol. Med. 1950, 74, 78–82. [Google Scholar] [CrossRef] [PubMed]
- Young, C.M.; Scanlan, S.S.; Topping, C.M.; Simko, V.; Lutwak, L. Frequency of feeding, weight reduction, and body composition. J. Am. Diet. Assoc. 1971, 59, 466–472. [Google Scholar]
- Scrimshaw, N.S. Criteria for valid nitrogen balance measurement of protein requirements. Eur. J. Clin. Nutr. 1996, 50 (Suppl. 1), S196–S197. [Google Scholar]
- Symons, T.B.; Sheffield-Moore, M.; Mamerow, M.M.; Wolfe, R.R.; Paddon-Jones, D. The anabolic response to resistance exercise and a protein-rich meal is not diminished by age. J. Nutr. Health Aging 2011, 15, 376–381. [Google Scholar] [CrossRef] [Green Version]
- Bouillanne, O.; Curis, E.; Hamon-Vilcot, B.; Nicolis, I.; Chretien, P.; Schauer, N.; Vincent, J.P.; Cynober, L.; Aussel, C. Impact of protein pulse feeding on lean mass in malnourished and at-risk hospitalized elderly patients: A randomized controlled trial. Clin. Nutr. 2013, 32, 186–192. [Google Scholar] [CrossRef]
- Yasuda, J.; Tomita, T.; Arimitsu, T.; Fujita, S. Evenly Distributed Protein Intake over 3 Meals Augments Resistance Exercise–Induced Muscle Hypertrophy in Healthy Young Men. J. Nutr. 2020. [Google Scholar] [CrossRef]
- Hudson, J.L.; Kim, J.E.; Paddon-Jones, D.; Campbell, W.W. Within-day protein distribution does not influence body composition responses during weight loss in resistance-training adults who are overweight. Am. J. Clin. Nutr. 2017. [Google Scholar] [CrossRef] [Green Version]
- Morley, J.E.; Abbatecola, A.M.; Argiles, J.M.; Baracos, V.; Bauer, J.; Bhasin, S.; Cederholm, T.; Coats, A.J.S.; Cummings, S.R.; Evans, W.J.; et al. Sarcopenia with limited mobility: An international consensus. J. Am. Med. Dir. Assoc. 2011, 12, 403–409. [Google Scholar] [CrossRef] [PubMed] [Green Version]
- Paddon-Jones, D.; Campbell, W.W.; Jacques, P.F.; Kritchevsky, S.B.; Moore, L.L.; Rodriguez, N.R.; van Loon, L.J. Protein and healthy aging. Am. J. Clin. Nutr. 2015, 101, 1339s–1345s. [Google Scholar] [CrossRef] [PubMed] [Green Version]
- Dillon, E.L.; Sheffield-Moore, M.; Paddon-Jones, D.; Gilkison, C.; Sanford, A.P.; Casperson, S.L.; Jiang, J.; Chinkes, D.L.; Urban, R.J. Amino acid supplementation increases lean body mass, basal muscle protein synthesis, and insulin-like growth factor-I expression in older women. J. Clin. Endocrinol. Metab. 2009, 94, 1630–1637. [Google Scholar] [CrossRef] [PubMed] [Green Version]
- Murphy, J.L.; Wootton, S.A.; Jackson, A.A. Variability of fecal energy content measured in healthy women. Am. J. Clin. Nutr. 1993, 58, 137–140. [Google Scholar] [CrossRef] [PubMed]
- Mittendorfer, B.; Andersen, J.L.; Plomgaard, P.; Saltin, B.; Babraj, J.A.; Smith, K.; Rennie, M.J. Protein synthesis rates in human muscles: Neither anatomical location nor fibre-type composition are major determinants. J. Physiol. 2005, 563, 203–211. [Google Scholar] [CrossRef] [Green Version]
- Lohman, T.G.; Going, S.B. Multicomponent models in body composition research: Opportunities and pitfalls. Basic Life Sci. 1993, 60, 53–58. [Google Scholar] [CrossRef]
- Wilson, J.P.; Mulligan, K.; Fan, B.; Sherman, J.L.; Murphy, E.J.; Tai, V.W.; Powers, C.L.; Marquez, L.; Ruiz-Barros, V.; Shepherd, J.A. Dual-energy X-ray absorptiometry-based body volume measurement for 4-compartment body composition. Am. J. Clin. Nutr. 2012, 95, 25–31. [Google Scholar] [CrossRef] [Green Version]
- Phillips, S.M.; Martinson, W. Nutrient-rich, high-quality, protein-containing dairy foods in combination with exercise in aging persons to mitigate sarcopenia. Nutr. Rev. 2019, 77, 216–229. [Google Scholar] [CrossRef] [Green Version]
- Kim, J.E.; O’Connor, L.E.; Sands, L.P.; Slebodnik, M.B.; Campbell, W.W. Effects of dietary protein intake on body composition changes after weight loss in older adults: A systematic review and meta-analysis. Nutr. Rev. 2016, 74, 210–224. [Google Scholar] [CrossRef] [Green Version]
- Morton, R.W.; Murphy, K.T.; McKellar, S.R.; Schoenfeld, B.J.; Henselmans, M.; Helms, E.; Aragon, A.A.; Devries, M.C.; Banfield, L.; Krieger, J.W. A systematic review, meta-analysis and meta-regression of the effect of protein supplementation on resistance training-induced gains in muscle mass and strength in healthy adults. Br. J. Sports Med. 2018, 52, 376–384. [Google Scholar] [CrossRef]
- Wycherley, T.P.; Moran, L.J.; Clifton, P.M.; Noakes, M.; Brinkworth, G.D. Effects of energy-restricted high-protein, low-fat compared with standard-protein, low-fat diets: A meta-analysis of randomized controlled trials. Am. J. Clin. Nutr. 2012, 96, 1281–1298. [Google Scholar] [CrossRef] [PubMed] [Green Version]
- Hudson, J.L.; Wang, Y.; Bergia, R.E., III; Campbell, W.W. Protein Intake Greater than the RDA Differentially Influences Whole-Body Lean Mass Responses to Purposeful Catabolic and Anabolic Stressors: A Systematic Review and Meta-analysis. Adv. Nutr. 2019. [Google Scholar] [CrossRef] [PubMed]
- Schaap, L.A.; van Schoor, N.M.; Lips, P.; Visser, M. Associations of Sarcopenia Definitions, and Their Components, With the Incidence of Recurrent Falling and Fractures: The Longitudinal Aging Study Amsterdam. J. Gerontol. A Biol. Sci. Med. Sci. 2018, 73, 1199–1204. [Google Scholar] [CrossRef] [PubMed]
Figure 1.
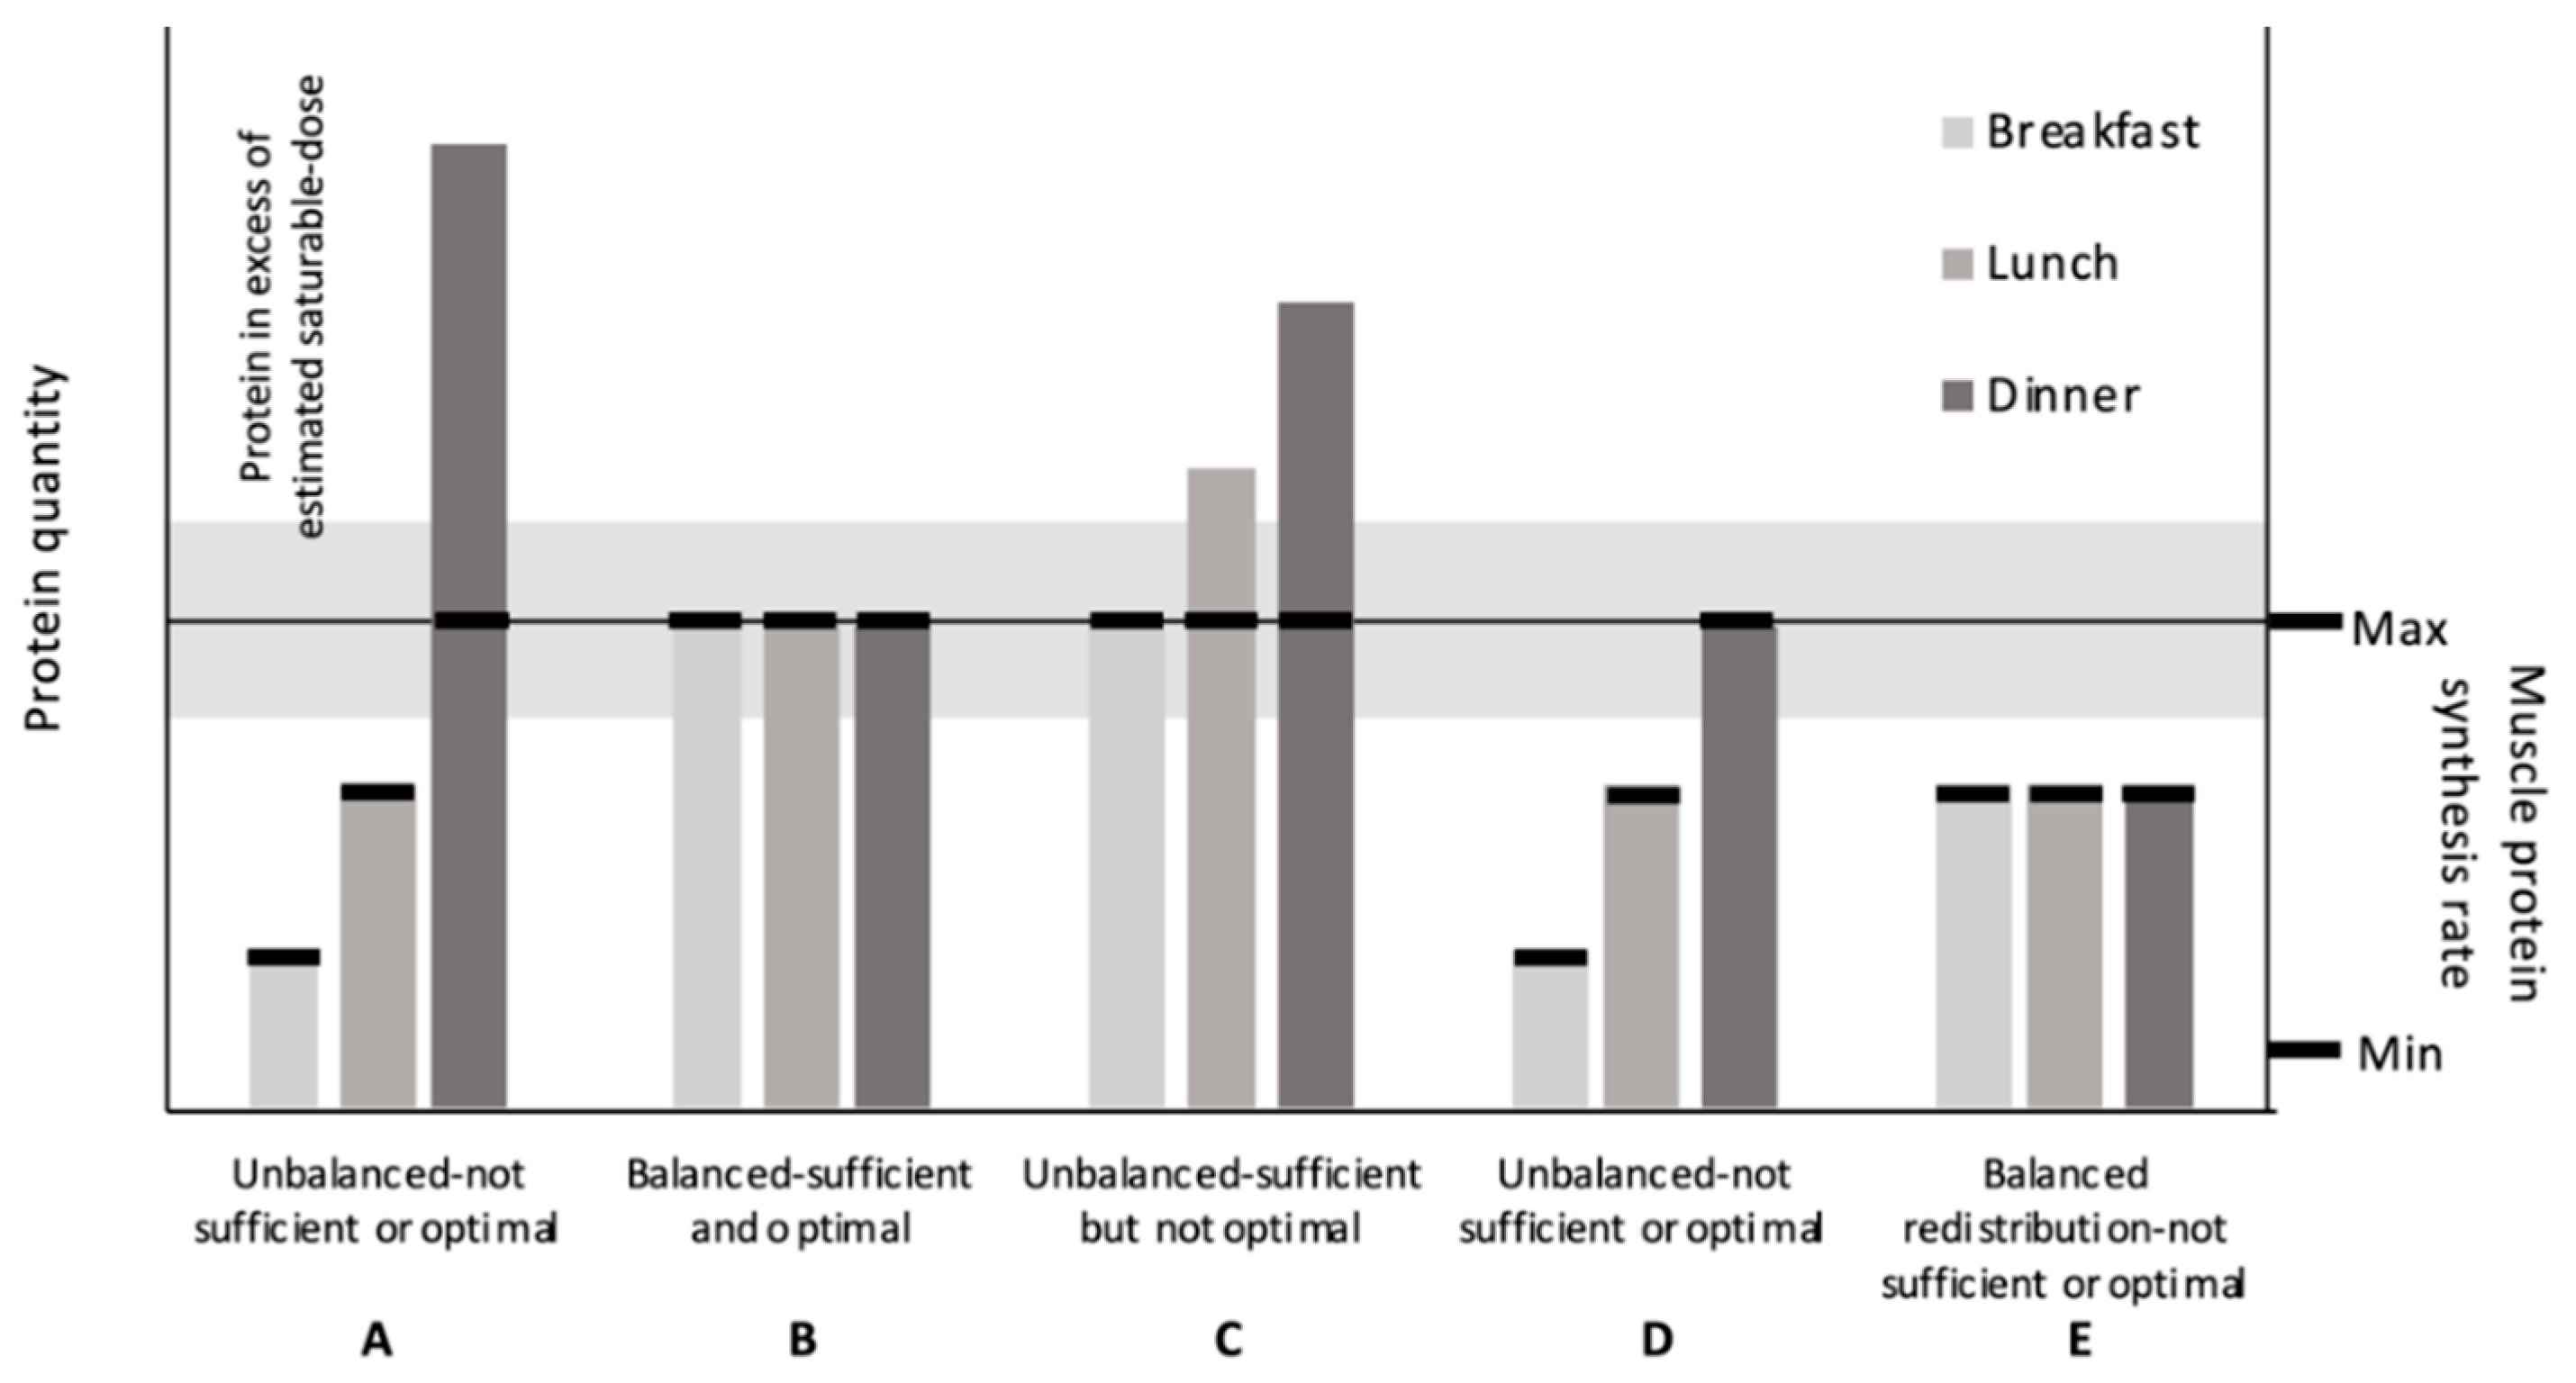
Theoretical relationship between protein quantity within meals and muscle protein synthesis (MPS) rates. (A) An example of an unbalanced protein distribution observed in the US. Exceeds the saturable dose limit for protein at one meal. (B) An “optimal” protein distribution; 1. provides sufficient protein per meal to maximize MPS without 2. exceeding the saturable dose estimates. (C) An unbalanced, higher-protein diet that provides sufficient protein per meal to maximize MPS but greatly exceeds saturable dose estimates at two meals. (D) An unbalanced, lower-protein diet that provides only one meal with sufficient protein to maximize MPS. (E) A redistributed balanced lower-protein diet; this results in three meals with insufficient protein to maximize MPS. (expanded adaption from Paddon-Jones and Rassmussen Curr Opin Clin Nutr Metab Care 2009, 12: 86–90).
Figure 1.
Theoretical relationship between protein quantity within meals and muscle protein synthesis (MPS) rates. (A) An example of an unbalanced protein distribution observed in the US. Exceeds the saturable dose limit for protein at one meal. (B) An “optimal” protein distribution; 1. provides sufficient protein per meal to maximize MPS without 2. exceeding the saturable dose estimates. (C) An unbalanced, higher-protein diet that provides sufficient protein per meal to maximize MPS but greatly exceeds saturable dose estimates at two meals. (D) An unbalanced, lower-protein diet that provides only one meal with sufficient protein to maximize MPS. (E) A redistributed balanced lower-protein diet; this results in three meals with insufficient protein to maximize MPS. (expanded adaption from Paddon-Jones and Rassmussen Curr Opin Clin Nutr Metab Care 2009, 12: 86–90).


Table 1.
Observational study characteristics.
| Authors | Population | Techniques | Outcome |
|---|---|---|---|
| Bollwein et al. [22] | 194 adults from Nurnberg, Germany (≥75 y) | Dietary intake: food frequency questionnaire. Frailty: definition by Fried et al. [41] | Non-frail participants reported a more balanced protein distribution [median CV (min–max); 0.68 au (0.15–1.24)] than pre-frail [0.74 (0.07–1.29)] and frail participants [0.76 (0.18–1.33); total protein intakes were comparable (~1.1 g·kg−1·d−1) |
| Gingrich et al. [23] | 97 adults without functional limitations from Nuremburg, Germany (75–85 y) | Dietary intake: 7-d food records. Body composition: BIA. Skeletal muscle mass: estimated [42]. Leg strength, leg power, and hand grip strength: dynamometers | No association between daily protein intake quantity, balance of within-day distribution (CV), number of meals containing ≥0.4 g·kg−1, and number of meals containing ≥2.5 g leucine with leg strength, leg power, and hand grip strength |
| Ten Haaf et al. [24] | 140 community-dwelling adults from the Netherlands (81 ± 6 y) | Dietary intake: average of 2, 24-h recalls or from 3-d food records. Hand grip strength: dynamometer. Physical function: Short Physical Performance Battery tests. Quality of life: EQ-5D-5L. | Among the five outcomes, a more balanced protein distribution (spread CV < 0.43) was associated only with greater gait speed (β = −0.42) when compared to the intermediate CV (0.43–0.62) |
| Farsijani et al. [25] | 2-y follow up in 351 men and 361 women from the Quebec Longitudinal Study on Nutrition as a Determinant of Successful Aging study (67–84 y) | Dietary intake: average of 3, 24-h food recalls collected at baseline and at 2 y. Body composition: DXA | At baseline, men with the most balanced protein distribution (CV ≤ 0.33 au) had higher whole-body and appendicular lean mass at baseline than did those with the most unbalanced distribution (CV ≥ 0.67 au). No differences among women. At 2-y, a more balanced distribution was negatively associated with higher whole-body and appendicular lean mass in both men and women. Protein distribution was not associated with changes in lean tissue over 2 y |
| Farsijani et al. [26] | 3-y follow up in 827 men and 914 women from the Quebec Longitudinal Study on Nutrition as a Determinant of Successful Aging study (67–84 y) | Dietary intake: data from the 2-y follow-up. Hand, leg, and arm strength: dynamometers. Mobility: timed-up-and-go, chair stand, and walking speed tests | A more balanced distribution was associated with a higher muscle strength score at 2-y in men and women (β ± SE = −0.73 6 ± 0.20 and −0.66 ± 0.20, respectively). Similar negative associations were observed between protein distribution with handgrip and arm strengths. These associations were significant before and after adjustment for covariates in women and only before adjustment for covariates in men with a trend toward significance after adjustment. The association between leg strength and protein distribution was not significant in either sex. Protein distribution was not associated with the decline in composite and component mobility scores |
| Loenneke et al. [27] and Loprinzi et al. [28] | 1081 adults from the 1999–2002 NHANES cohort of (50–85 y) | Dietary intake: a 24-h dietary recall method. Leg lean mass: DXA. Knee extensor strength: dynamometer | Compared to 0 meals, consuming 1 and 2+ meals/d with ≥30 g of protein was associated with greater leg lean mass (1 vs. 0, β = 23.6; 2+ vs. 0, β = 51.1) and knee extensor strength (1 vs. 0, β = 1160; 2+ vs. 0, β = 2389) |
| Gayatán Gonález et al. [29] | 187 adults from Mexico (60–97 y) | Dietary intake: a 24-h dietary recall method on a single day. Functionality: questionnaire to determine ADL and IADL scores | Compared to 0 meals, consuming 2 or 3, but not 1, meals/d with ≥30 g protein was associated with lower risk of physical disability on transportation (OR [95% CI]: 0.06 [0.01–0.50]), shopping (0.05[0.01–0.40]), feeding (0.06 [0.01–0.74]), and transfer (0.09 [0.01–0.98]). Consuming 2 or 3, but not 1, meals/d with ≥0.4 g/kg was associated with lower risk of physical disability on shopping (0.21 [0.05–0.89]) and transportation (0.12 [0.03–0.48]) |
| Mishra et al. [30] | 4123 adults from the 2011–2014 NHANES cohort (≥51 y) | Dietary intake: a 24-h dietary recall method. Grip strength: hand dynamometer | Compared to 1 meal, consuming 2 and ≥3 meals containing ≥ 25 g protein was not associated with grip strength |
| Valenzuela et al. [31] | 78 adults from Mexico (68.7 ± 6.3 y) | Dietary intake: a 24-h dietary recall method on 3 non-consecutive days. Appendicular lean mass: DXA | After adjusting for weight, sex, and height, appendicular lean mass was not different between groups that consumed at least one meal containing ≥25 g of protein and those who did not |
| Gayatán Gonález et al. [32] | 190 adults from Mexico (53–97 y) | Dietary intake: a 24-h dietary recall method on a single day. Functionality: questionnaire to determine ADL and IADL | 30 g criterion: Low and middle ADL scores were associated with “inadequate” protein intake at lunch (low scores, OR = 3.82 [95% CI, 1.15–12.65]; middle scores, OR = 2.40 [1.03–5.62]). 0.4 g·kg−1 criterion: “Inadequate” protein intake at dinner was associated with middle IADL scores (OR = 7.64, [1.27–45.85]) |
| Yasuda et al. [33] | 233 adults from Japan (21.4 ± 2.4 y) | Dietary intake: photography on 3 non-consecutive days. Body composition: DXA | Total fat-free mass % was greater in those that consumed ≥0.24 g·kg−1 at three meals compared to those that did not consume ≥0.24 g·kg−1 in at least one meal (77.0 ± 0.5% vs. 75.2 ± 0.4%) |
Abbreviations: ADL, activities of daily living; BIA, bioelectrical impedance analysis; DXA, dual-energy-ray absorptiometry; CI; confidence interval; CV, coefficient of variation; IADL, instrumental activities of daily living; NHANES, National Health and Nutrition Examination Survey; OR, odds ratio; SE, standard error.
Table 2.
Acute randomized controlled protein ingestion studies.
| Protein, g (g/kg) | |||||||||||||||
|---|---|---|---|---|---|---|---|---|---|---|---|---|---|---|---|
| Authors | Study Design | Group 1 | n (f) | Age, y | Duration | Energy Status | Exercise Status | Meal Type | Protein Source (s) | Total | Breakfast | Lunch | Dinner | 4th Meal | Outcome |
| Mamerow et al. [34] | Cross-over | EVEN | 8 | 36.9 ± 3.1 | 24 h | EB | No RT | Whole-food | Animal and plant | 90 (1.17) | 30 (0.39) | 30 (0.39) | 30 (0.39) | 25% greater MPS in EVEN | |
| SKEW | 90 (1.17) | 10 (0.13) | 15 (0.20) | 65 (0.85) | |||||||||||
| Murphy et al. [36] | Cross-over within parallel | BAL | 10 | 65 ± 3 | 12 h | EB and ER phases | RT and No RT phases | Isolated intact protein | Whey micellar | 75 (0.77) | 25 (0.26) | 25 (0.26) | 25 (0.26) | 19% greater MPS in BAL in ER and ER + RT; no effect in EB | |
| SKEW | 10 | 66 ± 4 | 75 (0.78) | 10 (0.10) | 15 (0.16) | 50 (0.52) | |||||||||
| Kim et al. [35] | Parallel | RDA Even | 5 (4) | 66.4 ± 1.7 | 22 h | EB | No RT | Whole-food | Animal and plant | 65.8 (0.8) | 22.3 (0.3) | 21.5 (0.2) | 22 (0.3) | No effect | |
| RDA Uneven | 4 (1) | 64.0 ± 3.6 | 73.7 (0.8) | 11.1 (0.1) | 14.9 (0.2) | 47.8 (0.5) | |||||||||
| 2RDA Even | 5 (3) | 64.0 ± 2.7 | 112.4 (1.5) | 38 (0.5) | 36.5 (0.5) | 37.9 (0.5) | |||||||||
| 2RDA Uneven | 6 (2) | 68.4 ± 2.2 | 120.8 (1.4) | 18.1 (0.2) | 24.3 (0.3) | 78.4 (0.9) | |||||||||
| Kim et al. [43] | Parallel | Even | 7 (3) | 58.1 ± 2.4 | 23 h | EB | No RT | Whole-food | Animal and plant | (1.1) | (0.37) | (0.37) | (0.37) | No effect | |
| Uneven | 7 (5) | 60.3 ± 2.4 | (1.1) | (0.17) | (0.22) | (0.72) | |||||||||
| Murphy et al. [44] | Parallel | BAL | 10 | 66 ± 4 | 2 wk | ER | RT and No RT phases | Whole-food | Animal and plant | (1.3) | (0.33) | (0.33) | (0.33) | (0.33) | No effect |
| SKEW | 10 | (1.3) | (0.09) | (0.22) | (0.94) | (0.05) | |||||||||
1 Group names reflect designations by the study authors. Abbreviations: EB, energy balance; ER, energy restriction; MPS, muscle protein synthesis; RDA, recommended dietary allowance; RT, resistance training.
Table 3.
Chronic protein ingestion research assessing the effect of protein distribution on nitrogen balance.
Table 3.
Chronic protein ingestion research assessing the effect of protein distribution on nitrogen balance.
| Authors | n (f) | Age, y | Protein, g·kg−1·d−1 | Meals, Number/d (g/kg/Meal) | Protein Sources | Adaptation/ Collection, d | Results |
|---|---|---|---|---|---|---|---|
| Arnal et al. [38] | 15 | 68 ± 1 | 1.05 | 3 (0.1/0.8/0.15) vs. 4 (0.22/0.33/0.2/0.3) | Whole-food animal and plant | 15/14 | Nitrogen balance was higher in 3 meals (unbalanced, 54 ± 7 mg/fat-free mass) vs. 4 meals (balanced, 27 ± 6 mg/fat-free mass) |
| Arnal et al. [39] | 16 | 26 ± 1 | 1.2 | 3 (0.08/0.95/0.17) vs. 4 (0.26/0.37/0.23/0.34) | Whole-food animal and plant | 15/14 | Nitrogen balance was 60% lower in 3 (unbalanced, 36 ± 8 mg/fat-free mass) vs. 4 meals (balanced, 59 ± 12 mg/fat-free mass) (p = 0.16) |
Table 4.
Chronic protein ingestion research assessing the effect of protein distribution on body composition.
Table 4.
Chronic protein ingestion research assessing the effect of protein distribution on body composition.
| Authors | Group 1 | n (f) | Age, y | Duration | Energy Status | Exercise Status | Protein Source(s) | Protein, g (g/kg) | Results | ||||
|---|---|---|---|---|---|---|---|---|---|---|---|---|---|
| Total | Breakfast | Lunch | Snack | Dinner | |||||||||
| Bouillanne et al. [72] | Spread | 34 (23) | 85.7 (83.5–87.9) | 6 wk | None | None | Animal and plant | 69 (1.27) | 12.2 (0.25) | 21 (0.38) | 13.5 (0.25) | 21.1 (0.38) | Pulse feeding increased lean mass (0.91 [0–1.48]); spread feeding decreased lean mass (−0.41 [1.53–0.49]) |
| Pulse | 29 (23) | 84.1 (81.8–86.4) | 66 (1.31) | 4.5 (0.08) | 47.8 (1.02) | 2.3 (0.03) | 10.9 (0.14) | ||||||
| Kim et al. [43] | EVEN | 7 (3) | 58.1 ± 2.4 | 8 wk | EB | No RT | Animal and plant | 87.8 (1.1) | 29.3 (0.37) | 29.3 (0.37) | — | 29.2 (0.37) | No effect |
| UNEVEN | 7 (5) | 60.3 ± 2.4 | 86.4 (1.1) | 13.1 (0.16) | 17.7 (0.22) | — | 55.6 (0.7) | ||||||
| Adechian et al. [62] | Casein spread | 10 (8) | 35.1 ± 1.5 | 6 wk | ER | None | >80% casein | 87 (0.94) | 22 (0.24) | 22 (0.24) | 22 (0.24) | 22 (0.24) | No effect |
| Casein pulse | 10 (8) | 34.6 ± 1.4 | >80% casein | 87 (0.96) | 7 (0.08) | 70 (0.77) | 3 (0.04) | 7 (0.08) | |||||
| MSP spread | 11 (7) | 33.6 ± 1.8 | >80% MSP | 87 (0.93) | 22 (0.23) | 22 (0.23) | 22 (0.23 | 22 (0.23 | |||||
| MSP pulse | 10 (9) | 30.6 ± 2.3 | >80% MSP | 87 (1.01) | 7 (0.09) | 70 (0.80) | 3 (0.04) | 7 (0.09) | |||||
| Hudson et al. [74] | EVEN | 21 | 33 | 16 wk | ER | RT | 70% animal; 30% plant | 90 (1.1) | 30 (0.36) | 30 (0.36) | — | 30 (0.36) | No effect |
| SKEW | 20 | 36 | 90 (1.1) | 10 (0.12) | 20 (0.24) | — | 60 (0.71) | ||||||
| Yasuda [73] | Low-protein breakfast | 14 | 20.8 ± 0.4 | 12 wk | None | RT | Animal, plant, and supplement | 97.1 (1.45) | 7.7 (0.12) | 30 (0.45) | — | 55.4 (0.83) | Lean mass increases tended to be greater after consuming the high-protein breakfast (2.5 ± 0.3 kg) than after consuming the low-protein breakfast (1.8 ± 0.3 kg) (p = 0.06) |
| High-protein breakfast | 12 | 89.4 (1.3) | 22.6 (0.33) | 31.8 (0.46) | — | 32.4 (0.48) | |||||||
1 Group names reflect designations by the study authors. Abbreviations: EB, energy balance; ER, energy restriction; MSP, milk-soluble protein; RT, resistance training.
© 2020 by the authors. Licensee MDPI, Basel, Switzerland. This article is an open access article distributed under the terms and conditions of the Creative Commons Attribution (CC BY) license (http://creativecommons.org/licenses/by/4.0/).
Share and Cite
MDPI and ACS Style
Hudson, J.L.; Bergia, R.E.; Campbell, W.W. Protein Distribution and Muscle-Related Outcomes: Does the Evidence Support the Concept? Nutrients 2020, 12, 1441. https://doi.org/10.3390/nu12051441
AMA Style
Hudson JL, Bergia RE, Campbell WW. Protein Distribution and Muscle-Related Outcomes: Does the Evidence Support the Concept? Nutrients. 2020; 12(5):1441. https://doi.org/10.3390/nu12051441
Chicago/Turabian StyleHudson, Joshua L., Robert E. Bergia, and Wayne W. Campbell. 2020. "Protein Distribution and Muscle-Related Outcomes: Does the Evidence Support the Concept?" Nutrients 12, no. 5: 1441. https://doi.org/10.3390/nu12051441
Note that from the first issue of 2016, this journal uses article numbers instead of page numbers. See further details here.