:format(webp)/cdn.vox-cdn.com/uploads/chorus_image/image/20814523/20130618_mje_bk2_189.0.jpg)
Introduction
This is the third and final time I will look at historical walk and strikeout rates for prospects. If you followed my previous installments, much of this will look familiar to you; however, the results are more complex and different. For those who are new, the basic premise is this: how likely is it that an offensive prospect succeeds in the major leagues based only on his minor league walk and strikeout rates?
Previous Levels: Rookie | Short-A
Method
First, I compiled the minor league numbers for all Baseball America top 100 offensive prospects from 1990 to 2007. I stopped at this year to allow enough time for the player to achieve MLB success. I only include top 100 prospects to add in a form of scouting to the picture. Stats and scouting should work hand-in-hand and an analysis similar to this can help augment a scout’s evaluation of talent. Next, I compared each prospect’s walk and strikeout rate to the league average that year, creating BB+ and K+ metrics. Finally, I compared the walk and strikeout rates at various ages and levels of prospects in the minor leagues to their career MLB Fangraphs Batting runs.
Grading the best tools in the major leagues
 Have you ever wanted to see a grade for Carlos Gonzalez's power, Craig Kimbrel's slider, or any of the other top tools in the major leagues? Well if so, you're in luck.
In order to put players into the low, average, and high categories for BBs and Ks, I use a 15% variation from 100 BB+ or K+. This means that 85-115 marks average for each, while players below 85 are "Low" and players above 115 are "High." Since this analysis relies on bins, I allow for a 5% variation on the cutoffs. For instance, if a player has an 83 BB+ (78-88), I look at the historical percentages for both low and average walk rates.
Prospects are required to have 150 PAs at a level to qualify in this analysis.
The following table is an estimate of where these cutoffs actually lie in terms of BB% and K% values.
| BB% | K% | |
| Low | 7.7% | 15.4% |
| High | 10.5% | 20.8% |
A player with at least 0.01 Batting runs in 1500 career plate appearances is tagged "Productive," while players with negative batting runs or fewer than 1500 career PAs are "Busts." It is important to note that I am only interested in hitting ability. This is how Edgar Renteria ends up in the "Bust" category. He had a great career, accumulating 35.7 fWAR; however, his batting was worth -52.3 runs.
Results
Here are the historical results for prospects in short season A, split by BB%, K%, and age.
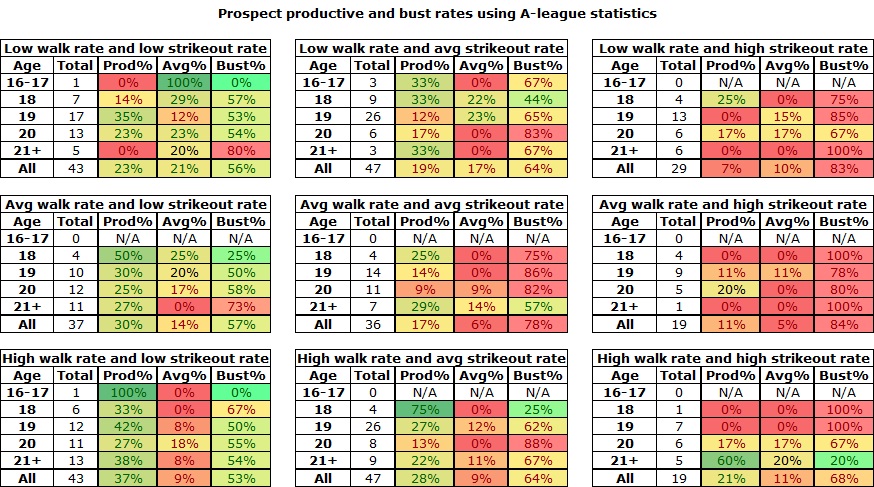
The success rates for the different categories are similar here to the Rookie level. High/High players have the best chance, while the players in trouble tend to gather towards average.
Here is an overall success table for this level, based solely on age.
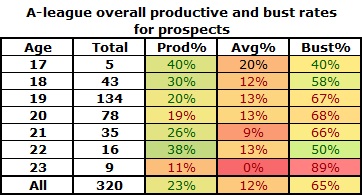
Teams seem to send drafted college players to short-season A, hence the large number of 21-year olds. Once a player is in his age-22 season, he should be ready for the next level.
Prospects in 2013
How do 2013 preseasons consensus top 190 prospects and early draft picks that played in single-A this year stack up in this analysis?
| Name | Team | BB+ | SO+ | Prod% | Avg% | Bust% |
| Jeimer Candelario | Cubs | 135 | 75 | 42% | 8% | 50% |
| Jesse Winker | Reds | 147 | 76 | 42% | 8% | 50% |
| Albert Almora | Cubs | 71 | 54 | 35% | 12% | 53% |
| Jose Peraza | Braves | 77 | 62 | 35% | 12% | 53% |
| Byron Buxton | Twins | 156 | 85 | 34% | 10% | 56% |
| Carlos Correa | Astros | 127 | 78 | 33% | 0% | 67% |
| Adalberto Mondesi | Royals | 72 | 108 | 33% | 0% | 67% |
| Jacob May | White Sox | 79 | 92 | 33% | 0% | 67% |
| Adam Walker | Twins | 64 | 102 | 33% | 0% | 67% |
| Devon Travis | Tigers | 117 | 46 | 33% | 4% | 63% |
| Jorge Polanco | Twins | 91 | 55 | 30% | 20% | 50% |
| Patrick Wisdom | Cardinals | 113 | 132 | 30% | 10% | 60% |
| Dan Vogelbach | Cubs | 130 | 74 | 27% | 18% | 55% |
| Mookie Betts | Red Sox | 194 | 58 | 27% | 18% | 55% |
| Kevin Plawecki | Mets | 93 | 56 | 27% | 0% | 73% |
| Corey Seager | Dodgers | 124 | 91 | 27% | 12% | 62% |
| Rio Ruiz | Astros | 121 | 95 | 27% | 12% | 62% |
| Colin Moran | Marlins | 98 | 70 | 25% | 17% | 58% |
| Brandon Drury | Diamondbacks | 92 | 77 | 25% | 17% | 58% |
| Dorssys Paulino | Indians | 65 | 85 | 24% | 25% | 51% |
| Rosell Herrera | Rockies | 127 | 86 | 20% | 9% | 71% |
| Josh Bell | Pirates | 114 | 85 | 18% | 11% | 71% |
| Tim Anderson | White Sox | 87 | 127 | 18% | 8% | 73% |
| Max Kepler | Twins | 104 | 80 | 17% | 13% | 70% |
| Carlos Tocci | Phillies | 55 | 82 | 17% | 50% | 33% |
| Bubba Starling | Royals | 121 | 126 | 17% | 17% | 67% |
| Jorge Alfaro | Rangers | 76 | 129 | 17% | 17% | 67% |
| Patrick Kivlehan | Mariners | 78 | 83 | 17% | 10% | 73% |
| Gregory Bird | Yankees | 212 | 113 | 15% | 8% | 77% |
| Barrett Barnes | Pirates | 94 | 114 | 14% | 7% | 79% |
| Lewis Brinson | Rangers | 109 | 186 | 11% | 11% | 78% |
| Roman Quinn | Phillies | 103 | 105 | 9% | 9% | 82% |
| Nick Williams | Rangers | 42 | 133 | 0% | 15% | 85% |
| Joey Gallo | Rangers | 122 | 181 | 0% | 0% | 100% |
| Victor Roache | Brewers | 101 | 130 | 0% | 0% | 100% |
| Brandon Dixon | Dodgers | 55 | 140 | 0% | 0% | 100% |
| Nomar Mazara | Rangers | 99 | 127 | 0% | 0% | 100% |
At the top of the list are two lesser prospects than some of the heavy hitters in this level. Look for both Candelario and Winker to be promoted to at least advanced-A next season and move up prospect lists as well. After those two, we find some elite and well-known guys, including Buxton, the top prospect in baseball. He spent enough time in advanced-A to be considered for that list, and actually improved his stock more at that level. Almora and Correa are right there with him, along with Peraza, Baseball
Mondesi appears near the top of the list on the strength of his age. As he starts moving up the ladder, he will need to start walking more often, and that may come with maturity as a hitter. However, his strikeouts don’t pose a threat thus far in his career. There have been very few 18 year-old prospects above single-A, so I don’t envision the Royals promoting him until 2015, but if he continues to grow and mature, it is possible he reaches high-A at the end of next season.
At the bottom of the chart are the Rangers prospects. They have a lot of all-or-nothing power hitters who are providing more nothing than all. The only productive hitters with similar rates in single-A were Russell Branyan, Mike Cameron, Preston Wilson, Austin Kearns, and Josh Phelps. Cameron and Wilson had more speed than the Rangers quintuplets, while
Conclusion
Single-A is the place where prospects start honing their approach. Those who are able to do so get the call up to better and more advanced leagues, while those who don’t start to flame out quickly. Extreme approaches are no longer rewarded but instead a good mix of walking more than striking out.
Which other players in single-A caught your eye this year?
. . .
Statistics courtesy of Fangraphs and Baseball Prospectus.
Chris St. John is a writer at Beyond The Box Score. You can follow him on Twitter at @stealofhome.
More from Beyond the Box Score:
- The Jhonny Peralta question
- Qualifying offers and options: The hitchhiker's guide
- The Red Sox, the 2013 World Series and Baseball's Soul
- First and worst: Four seam fastballs of 2013
- The art of the strikeout: Darvish vs. Guthrie