:format(webp)/cdn.vox-cdn.com/uploads/chorus_image/image/20430649/146406959.0.jpg)
Introduction
This is the third and final time I will look at historical walk and strikeout rates for prospects. If you followed my previous installments, much of this will look familiar to you; however, the results are more complex and different. For those who are new, the basic premise is this: how likely is it that an offensive prospect succeeds in the major leagues based only on his minor league walk and strikeout rates?
Previous Levels: Rookie
Method
First, I compiled the minor league numbers for all Baseball America top 100 offensive prospects from 1990 to 2007. I stopped at this year to allow enough time for the player to achieve MLB success. I only include top 100 prospects to add in a form of scouting to the picture. Stats and scouting should work hand-in-hand and an analysis similar to this can help augment a scout’s evaluation of talent. Next, I compared each prospect’s walk and strikeout rate to the league average that year, creating BB+ and K+ metrics. Finally, I compared the walk and strikeout rates at various ages and levels of prospects in the minor leagues to their career MLB Fangraphs Batting runs.
Manny Machado and a young hitter's development
 Alex Skillin looks at the adjustments former prospect Manny Machado has to make.
In order to put players into the low, average, and high categories for BBs and Ks, I use a 15% variation from 100 BB+ or K+. This means that 85-115 marks average for each, while players below 85 are "Low" and players above 115 are "High." Since this analysis relies on bins, I allow for a 5% variation on the cutoffs. For instance, if a player has an 83 BB+ (78-88), I look at the historical percentages for both low and average walk rates.
Prospects are required to have 75 PAs at a level to qualify in this analysis.
The following table is an estimate of where these cutoffs actually lie in terms of BB% and K% values.
| BB% | K% | |
| Low | 7.7% | 15.4% |
| High | 10.5% | 20.8% |
A player with at least 0.01 Batting runs in 1500 career plate appearances is tagged "Productive," while players with negative batting runs or fewer than 1500 career PAs are "Busts." It is important to note that I am only interested in hitting ability. This is how Edgar Renteria ends up in the "Bust" category. He had a great career, accumulating 35.7 fWAR; however, his batting was worth -52.3 runs.
Results
Here are the historical results for prospects in short season A, split by BB%, K%, and age.
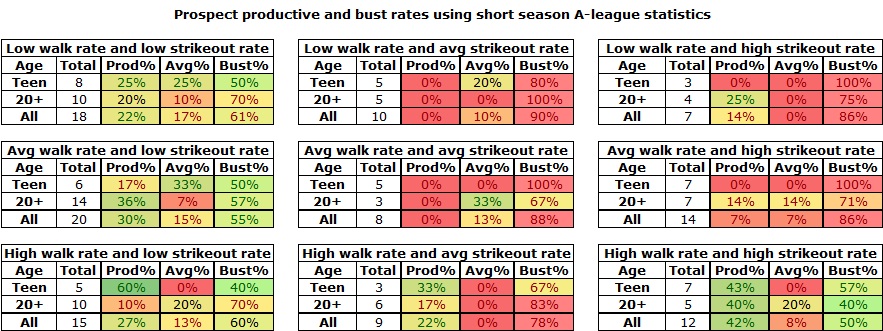
The success rates for the different categories are similar here to the Rookie level. High/High players have the best chance, while the players in trouble tend to gather towards average.
Here is an overall success table for this level, based solely on age.
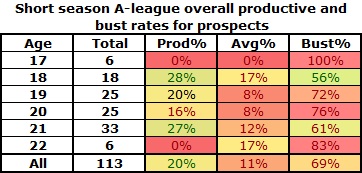
Teams seem to send drafted college players to short-season A, hence the large number of 21-year olds. Once a player is in his age-22 season, he should be ready for the next level.
Prospects in 2013
How do 2013 preseasons consensus top 190 prospects and early draft picks that played in short-season A this year stack up in this analysis?
| Name | Team | BB+ | SO+ | Prod% | Avg% | Bust% |
| Brian Ragira | Giants | 145 | 122 | 40% | 20% | 40% |
| Brandon Thomas | Yankees | 127 | 155 | 40% | 20% | 40% |
| Tzu-Wei Lin | Red Sox | 127 | 109 | 33% | 0% | 67% |
| Eric Jagielo | Yankees | 142 | 120 | 28% | 10% | 62% |
| Yasiel Balaguert | Cubs | 115 | 126 | 27% | 17% | 56% |
| Gavin Cecchini | Mets | 78 | 68 | 25% | 25% | 50% |
| Michael O'Neill | Yankees | 59 | 160 | 25% | 0% | 75% |
| Adam Frazier | Pirates | 112 | 59 | 23% | 14% | 64% |
| Ryon Healy | Athletics | 16 | 77 | 20% | 10% | 70% |
| Chad Pinder | Athletics | 88 | 123 | 20% | 7% | 73% |
| Jeremy Sy | Giants | 153 | 105 | 17% | 0% | 83% |
| Kris Bryant | Cubs | 123 | 107 | 17% | 0% | 83% |
| Austin Wilson | Mariners | 89 | 90 | 14% | 13% | 74% |
| L.B. Dantzler | Blue Jays | 134 | 86 | 13% | 10% | 77% |
| Jared King | Mets | 157 | 90 | 13% | 10% | 77% |
| Jack Reinheimer | Mariners | 130 | 85 | 13% | 10% | 77% |
| Kelvin Encarnacion | Cubs | 133 | 85 | 13% | 10% | 77% |
| Hunter Renfroe | Padres | 53 | 113 | 13% | 0% | 88% |
| Shawon Dunston | Cubs | 149 | 54 | 10% | 20% | 70% |
| D.J. Peterson | Mariners | 125 | 71 | 10% | 20% | 70% |
| Ty Young | Rays | 113 | 109 | 8% | 17% | 75% |
| Andrew Knapp | Phillies | 106 | 111 | 7% | 24% | 69% |
| Matthew Oberste | Mets | 43 | 99 | 0% | 0% | 100% |
Thomas was ranked as the 134th best prospect in the 2013 draft, but fell to the Yankees in the 8th round. His ratios looked good this year, but he will have to really drop his K totals next season to stick as someone to watch. Gavin Cecchini was the only top prospect from last season and his prod% is better than average. However, he will need to start walking more often or those chances may drop significantly.
Bryant climbed the ladder from Rookie to Short-season A to High-A this year, but will only appear on this list due to playing time requirements. His percentages don’t look good here, but are much more favorable in the short time he spent at Daytona. He only had three walks in 62 PAs, which would be far too low in a full season, but his chance at becoming a productive hitter from those stats sits at 29%.
Peterson is another early 2013 draft pick that hurt his chances in short-season A but improved them later in the season. Unfortunately, he was hit by a pitch and suffered a broken jaw in August. As long as there are no lasting effects from that injury, his prod% currently sits at 33% based on 107 PAs at Class A Clinton.
Assuming each of these players move up to High-A next year, some may have to improve their approach to continue to be successful. For instance, a High/High approach works in the low levels, but not as well in A+. Ragira, Jagielo, and Thomas in particular will need to cut down the Ks to stay relevant. On the other hand, if Wilson and Knapp simply maintain their average approaches in A+, they will increase their stock.
Conclusion
Short-season A is very similar to the Rookie levels in that extreme approaches lend themselves to more productive future hitters. However, the hitters tend to be slightly older in this level, probably due to teams sending college draft picks there immediately after signing. Which other players in Short-season A ball caught your eye this year?
. . .
Statistics courtesy of Fangraphs and Baseball Prospectus.
Chris St. John is a writer at Beyond The Box Score. You can follow him on Twitter at @stealofhome.
More from Beyond the Box Score:
- How to win the wild card game
- The Dusty Baker cunundrum
- Manny Machado and a young hitter's development
- Yan Gomes and the (w)Indians
- Scott Kazmir: Young dog, new tricks